Thursday, December 22, 2022

Plant-Pollinator Interactions in Yavapai County, AZ

 Introduction

Pollinators visit plants seeking 
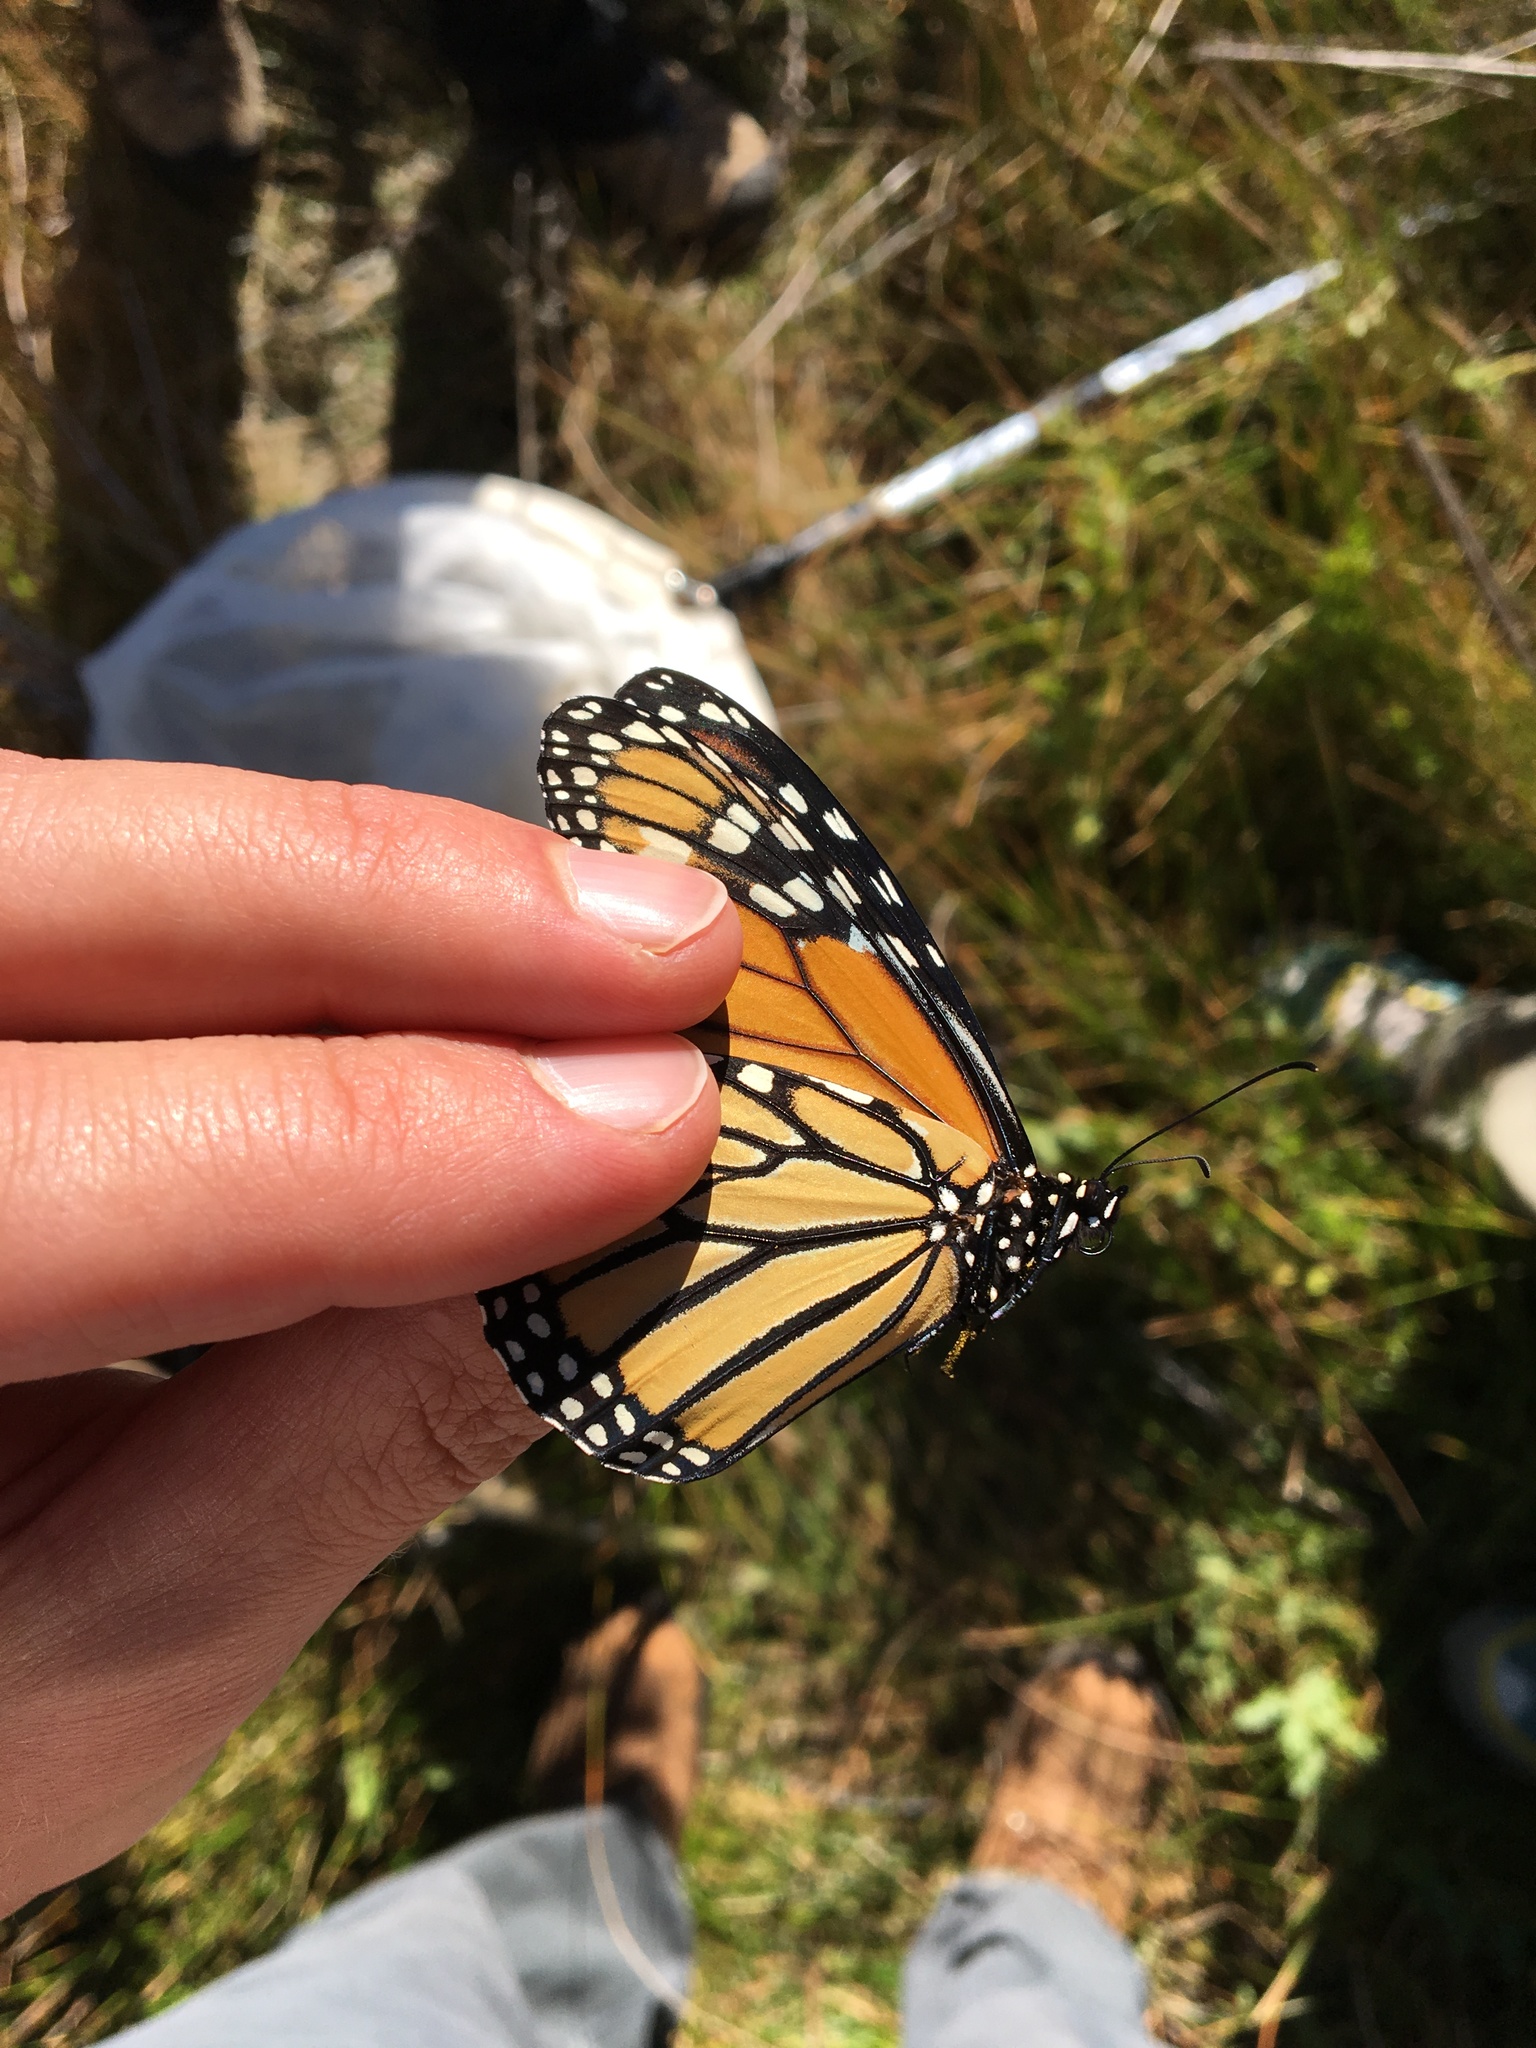
nectar and/or pollen. Pollinators include insects (e.g. butterflies, moths, beetles, bees, wasps, flies), bats, and birds. In any geographic region, native and non-native pollinators visit native and non-native plants.

Pollinators may be specialists and/or generalists who visit plants for different reasons. For example, some pollinators specialize on the pollen of certain plant species such that they visit only certain plants to harvest pollen from them. These pollen-seeking specialists may be nectar-seeking generalists to the extent that they indiscriminately harvest nectar from any plant species.

Pollinator-plant interactions are a subject of ongoing study. In North America alone there are more than 3,600 bee species. Ecologists document pollinator-plant interactions to understand which pollinators visit which plant species and why.


Methods

We use iNaturalist—a citizen science computer application—to document our observations of pollinators and plants in the places we visit. We have five years of non-systematic observation data from Yavapai County, AZ that we use for our analysis. We looked at which plant species are most frequently visited by pollinators across different taxa. This will help us better understand which local plant species are popular amongst pollinators.

We annotated five years of pollinator observation records from Yavapai County, AZ with the scientific name of the plant species each pollinator is visiting. Our database includes a total of 265 distinct counts of pollinator-plant interactions (note this is different from the number of observations).

Here is a link to our current plant-pollinator interactions in iNat.

There are some notable issues that exist with our data:

·        We did not systematically collect the data. We did not employ ecological sampling methods, we did not sample data at regular intervals of time, and we did not take measures to ensure we systematically sought observations of pollinators across distinct plant taxa in unbiased ways. Therefore, our dataset contains bias.

·        We are analyzing our dataset for fun. Since the data contain unintentional bias, we do not intend for the results of our analysis to be reliable for landscape or species management decisions.

·        Our data contain blank fields (unknowns) at the level of insect taxon family, genus, and species. Because we cannot fill in the blanks with reliable data, we conduct our analysis at the level of insect taxon (e.g. insect family, genus, or species).

·        Our database’s plant records contain plant taxa information at the level of genus and species.

See this post for more thoughts on the limitations of this type of analysis.


Total insect taxa associated with plant genera


Count of distinct insect taxa associated with the top ten plant genera by month

This graph reflects the top ten plant genera ranked according to the counts of distinct insect taxa associated with them. In our database, we have data for many more plant genera than those shown.

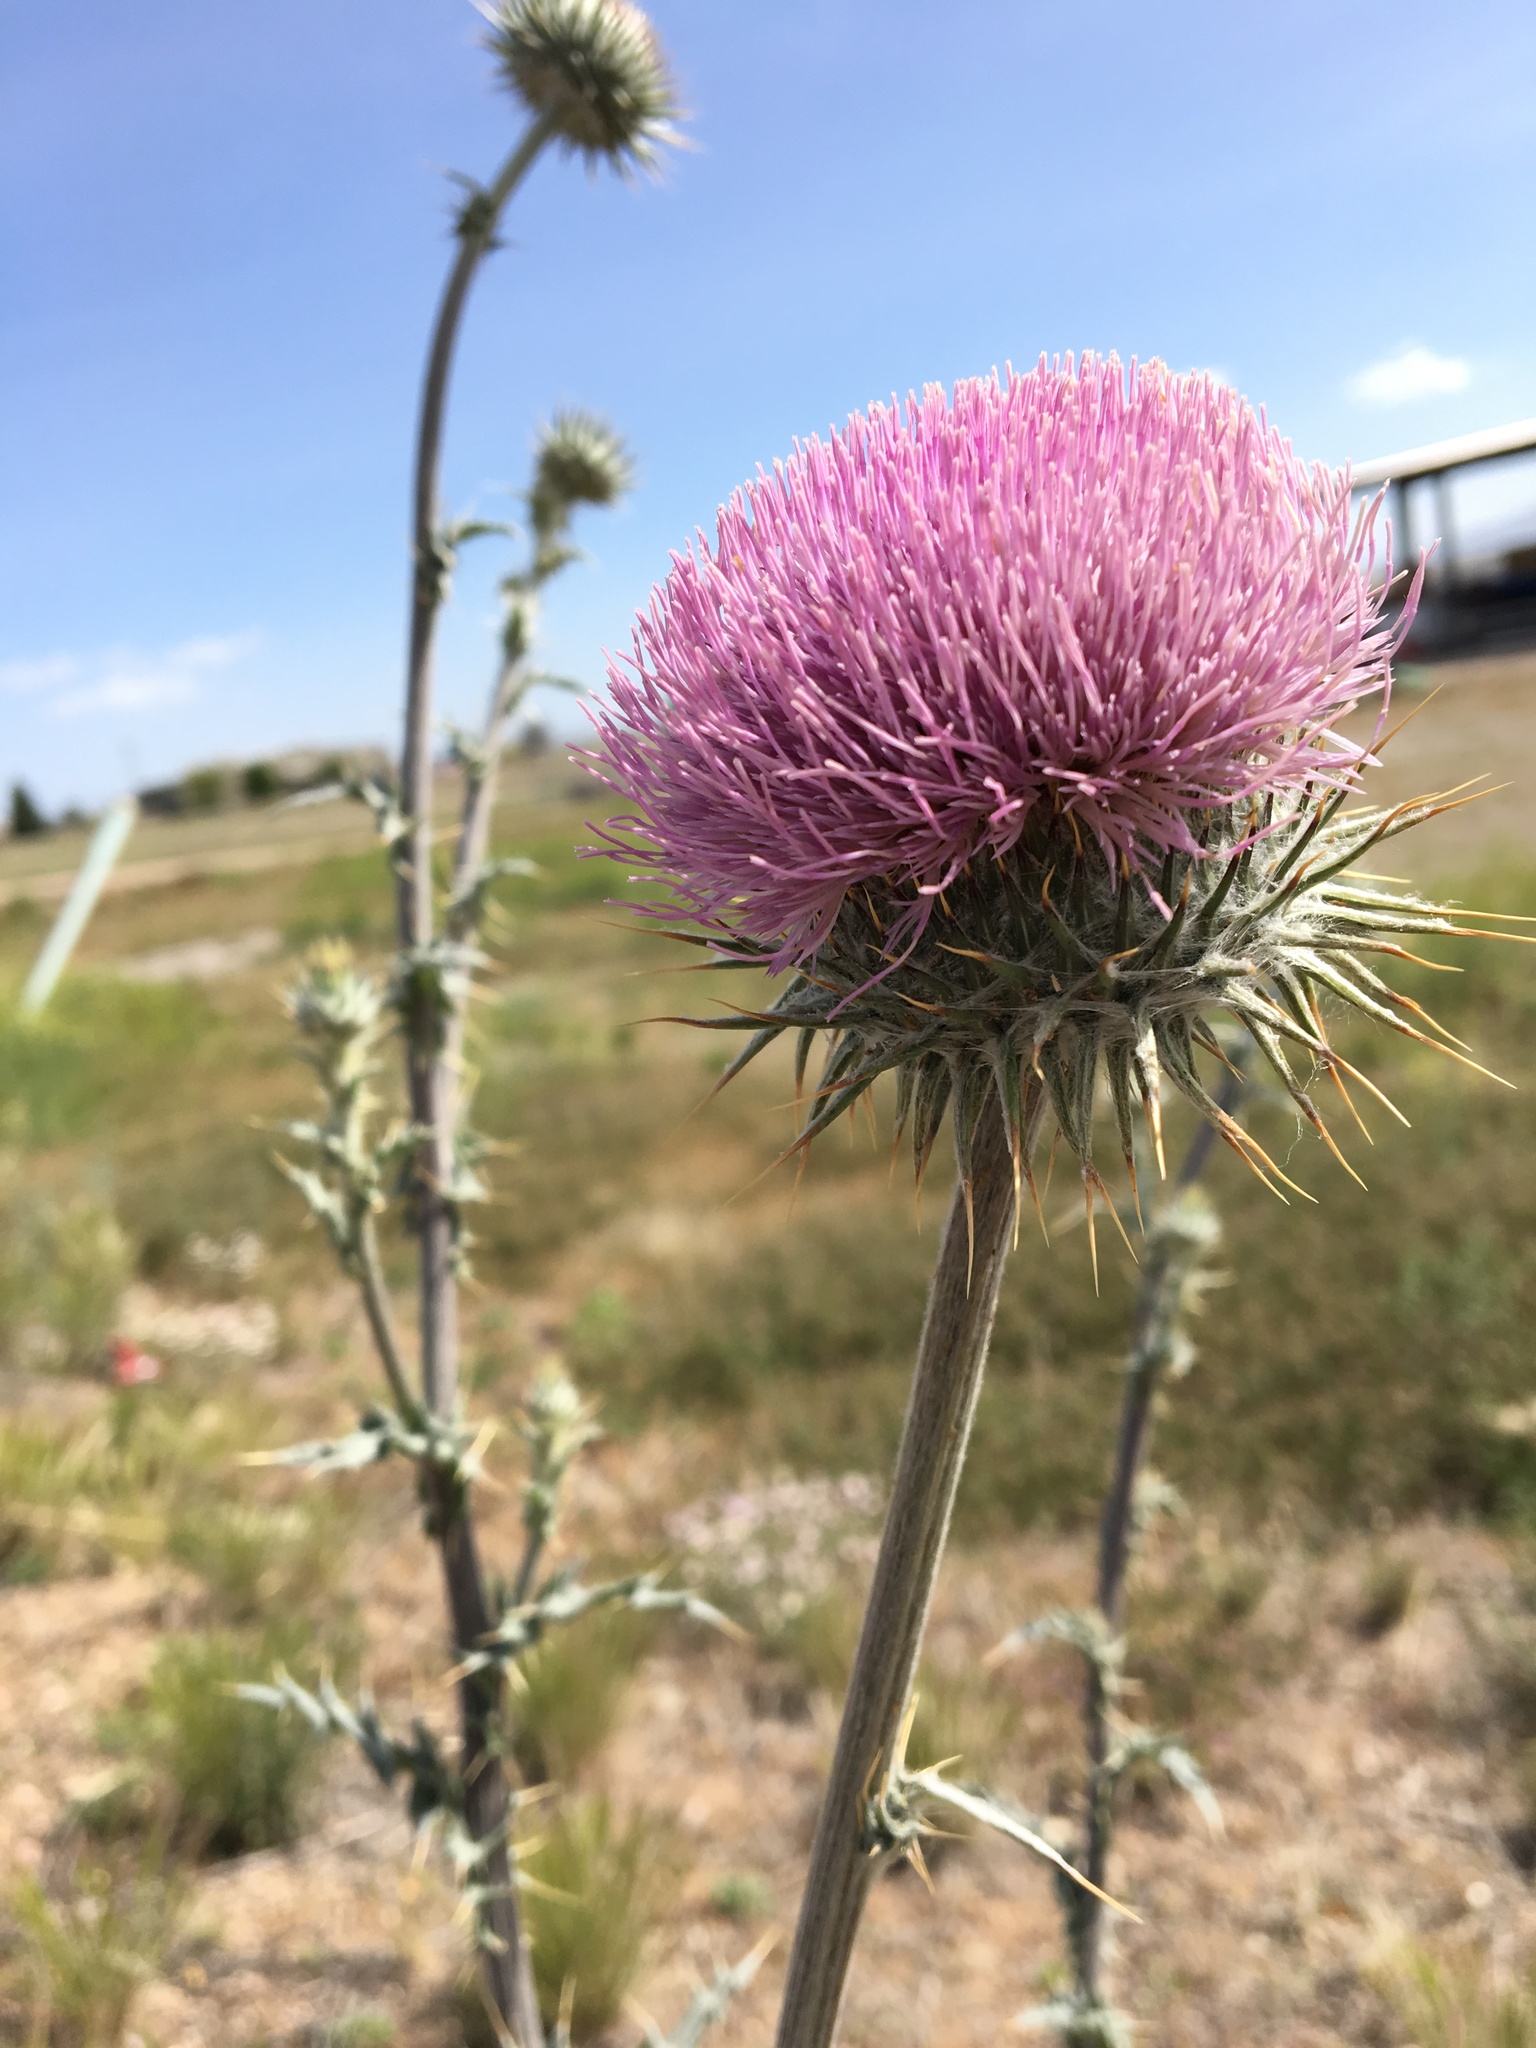
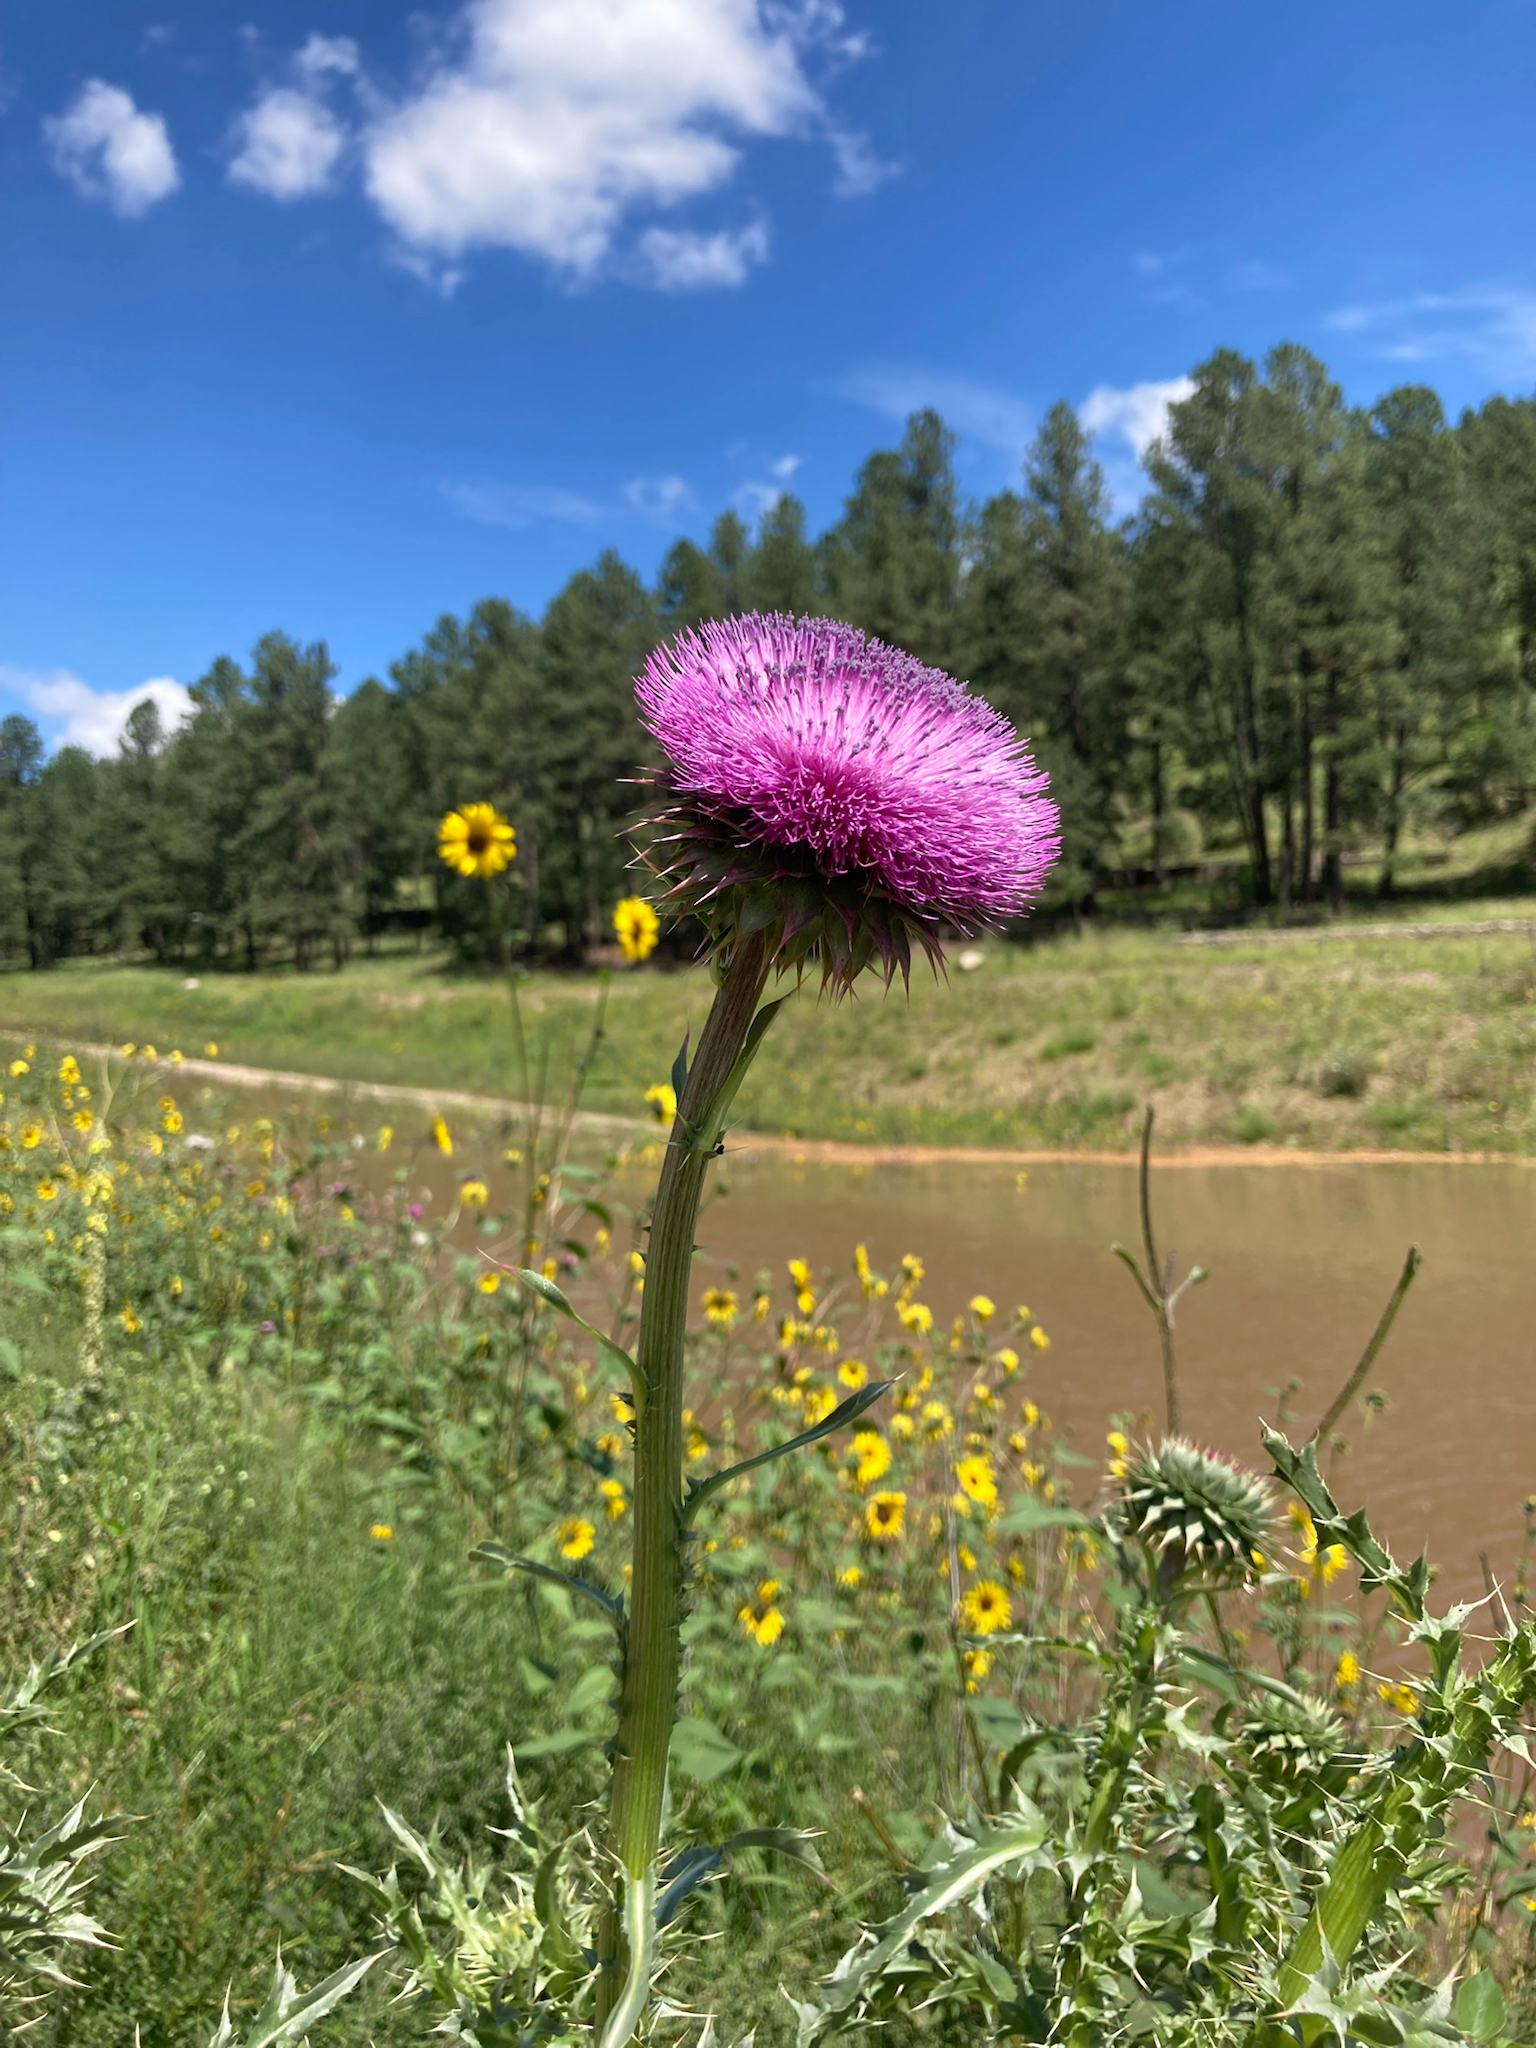
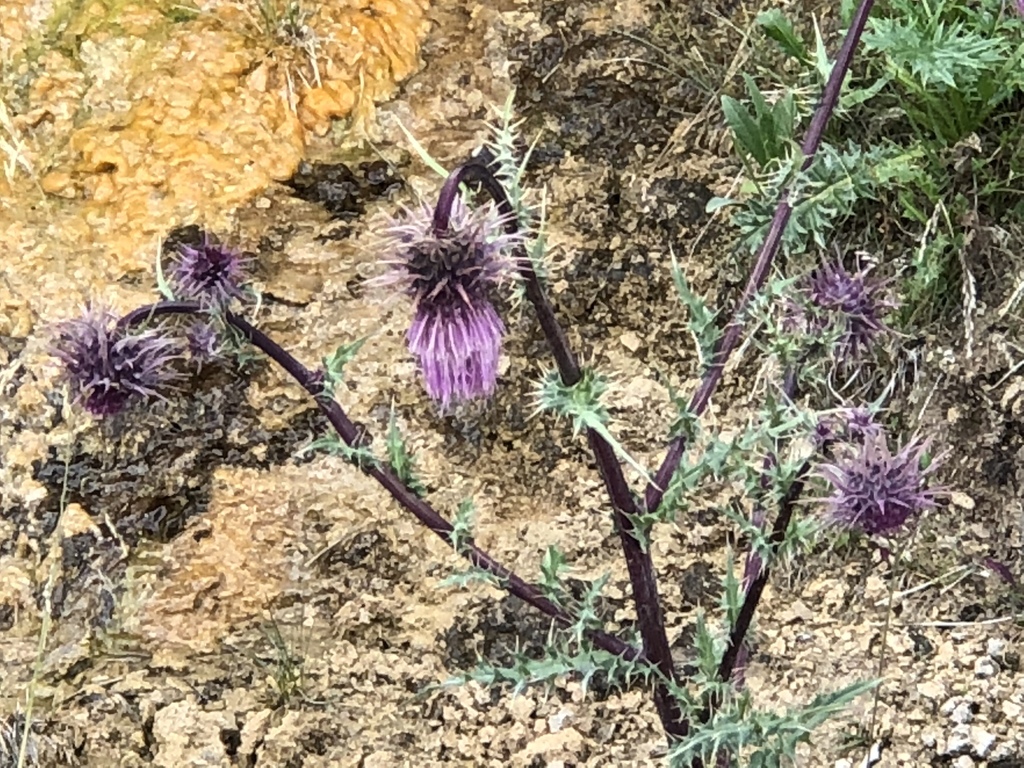
The top ten plant genera include Asclepias, Baccharis, Ceanothus, Cirsium, Dalea, Ericameria, Helianthus, Hymenothrix, Machaeranthera, and Opuntia. 

There may be more associations between distinct insect taxa and plant genera during the summer months of June, July, and August but they are not reflected in this graph because we didn’t observe them due to extreme heat and/or monsoon rains.


This project and data analysis were a collaboration between Conor Flynn and Alexandra Permar.  

Sunday, December 11, 2022

High Mowing's 2023 Organic Seed Catalog

 Things I learned from High Mowing Organic Seeds's 2023 Catalog

Grafting: in vegetables, only used for tomatoes. Instead of transplanting, graft onto established roots.

I remember hearing some drivel about how tomatoes aren't vegetables, they're a fruit.  But, botanically, half of the vegetables are fruits.  Beans, cucumbers, eggplant, melons, okra, peppers, pumpkins, squash, tomatoes, watermelon, zucchini.  I don't hear anyone proclaiming "green beans are fruits!"

Most category-consistent omission:  strawberry seeds. It’s a berry, not a vegetable!  Even though they are often grown as annuals, maybe they are marketed under the category of fruit trees and perennial fruit bushes...

Spinosad and Bt are popular organic insect pest controls and are non toxic to humans and, if used correctly, mostly harmless to beneficial insects. 

Most surprising omission: sweet potatoes seeds.  Maybe because HM are mostly focused on northern crops?  Also surprisingly limited selection of collard greens, okra and swiss chard.   I noticed on the HM website that all of the conference/expos they attend are in Northern-tier states.

Least surprising omission:  cannabis seeds.  Cash crop anyone?

Most interesting omission:  mushroom seeds.   Inoculant is very popular in some areas, but with mixed success.  Is the omission a sign of lack of interest?

Most organic omission:  Imperator-type carrots.  The main type sold commercially (even "baby carrots" are whittled from these), and HM has all of the other types:  Nantes, Danvers, Chantenay… the catalog sometimes references mainstream conventional varieties of other vegetables (e.g. "Payday") but doesn't include them.  Seems organic breeders have mostly focused outside the mainstream.

Interesting which vegetables don't have disease resistance traits.  Do they not need it or has it not been selected yet?

Most confusing "seeds":  potatoes.  Apparently no one grows potatoes from seed.

Lowest-common denominator certification:  Non-GMO Project.  Is this the cheapest certification or just the best marketing logo?  Either way this seems to be the go-to certification for everything.  I have friends who say they won't buy GMO.  But organic?  Regenerative?  Bee Better?  Too expensive, what, what?  I guess it does make sense for High Mowing since they sell corn and soy. 

Pollinators

I was surprised there wasn't more mention of pollinator requirements.  Which vegetables need pollinators?  All of the fruits… 

But peas and soy can self-pollinate.  Corn should be planted in blocks so it can be wind-pollinated.

Gynoecious and monoecious cucumbers need to be planted with another variety for pollination. Parthenocarpic cucumbers don't need pollinators (= good for greenhouses). 

Seedless watermelons :  one variety needs pollination from a different variety. 

The insect apocalypse is real.  This summer I heard from people in different parts of the country who had to hand-pollinate their squash because they couldn't get any fruit otherwise.  I visited a remnant prairie patch in Ohio in July that was in full flower, but completely silent and devoid of insect life.  All blooming and no buzzing.

Hybrid vs OP vs Heirloom

Seed saving controversy:  Advocates like Bill McDorman make hybrid seeds seem almost immoral.  He claims seed-saving as an inalienable right of indigenous and small-holder farmers everywhere.  But its hard.  His very interesting book* gives detailed specifications for how far apart you have to plant different varieties to avoid cross-pollinating, in-breeding depression, or outbreeding depression.  I wonder how many farmers save seed?

Descriptions in HM imply that hybrids are better than OP.  Also interesting how many varieties are protected (from seed-saving) by UP or PVP. 

References

Bill McDoman. Basic Seed Saving: Easy step by step instructions for 18 popular vegetables. 

 Attachments

Excerpt from a conventional seed catalog.

SeedGenetics2023.png

Tuesday, November 15, 2022

Introduced versus Native Species

 Like almost all categories in nature, there are exceptions and ambiguities. 

How do we really know a species is non-native?  It might seem like an obvious category, but if you think about it, the "evidence" of absence before a certain date is just absence of evidence!  I know taxonomists who don't agree that certain species, widely regarded as non-native, are actually non-native.  They just think the species was under-collected before a certain date.  This is especially true when there is no strong ecological or geophysical reason for the species not to have spread naturally.  For example, species that are "native" to Eastern North America, but are considered "Introduced" in Western North America (e.g. American Bullfrog).

What about species that have both native and introduced genotypes?  Phragmites australis is a classic example from North America, where you have to ID to subspecies (often very difficult) to distinguish the native from invasive.  In iNat, if you only ID to species, it will say it is native.  Only the observations that have been ID'd to species have the Introduced tag. 

Other categories include:

Archaeophytes: plants which were probably introduced by humans to an area, but the introduction happened a very long time ago, and evidence is usually indirect. Most introductions before AD 1492 would fit in this category.  

Neo-natives: This is a rather new term denoting species that settle without human assistance in a new region (see Essl et al. 2019).  For example, range expansions due to global warming.  


More discussion:  https://forum.inaturalist.org/t/residency-status-for-archaeophyte-and-neo-native-plants/37252

What is Mitigation?

Different people have different definitions of "Mitigation" in the context of natural resource management, endangered species protection, and wetland permitting.


Technical Definitions
Technically, Mitigation (as defined by CEQ and DOI) includes avoidance, minimization, and compensatory mitigation.  

The mitigation hierarchy also adopts an inclusive definition of mitigation that includes a range of mitigation options.  The mitigation hierarchy is a framework that was formalized by IFC in 2012.  While there are many complexities in implementation, at its core the hierarchy offers a conceptually simple range of mitigation strategies, ranging from preventive (avoiding and minimizing) to remediative (restoring and offsetting).  

Mitigation hierarchy framework.(Source:  Exponent)


Popular Usage
However, many professional resources, including the USFWS webpage on Mitigation, simply define Mitigation as "projects or programs that help offset negative impacts to natural resources, such as a stream, wetland, and species-at-risk."  This definition excludes by omission any preventive mitigation.


Clarification
As usual, EPIC has a great resource summarizing the different types of mitigation, as well as synonyms that are often used.  According to EPIC, avoidance and minimization are called "conservation measures".  Only if a project is likely to cause take are compensatory mitigation measures proposed under 7(a)(2) consultation.  Compensatory mitigation, which is usually simply called "mitigation" in popular usage, is also called offset measures.

Table from EPIC report linked above.

In conclusion, mitigation can be a confusing concept, even for professionals.  Government agencies are trying to specify compensatory mitigation when that is the subset of mitigation they mean, but even in official publications they often use the simple term mitigation.  When someone says Mitigation they are usually talking about compensatory mitigation, or offsets.  However, when talking about the mitigation hierarchy, other preventive conservation measures such as avoidance and minimization could also be included.  

Friday, November 11, 2022

Popular plants for Monarch butterflies in Northern Arizona

**Updated 11/16/2022 


As of November, 2022, there were 260 observations on iNaturalist of monarch butterflies in the northern half of Arizona - basically everything north of Phoenix.  I analyzed these observations to try to identify which plants are most important nectar food sources.


iNat link.


I filled in the Life Stage annotation for all larva and pupa.  There are 62 observations of larva (caterpillars), 1 observation of a pupa, and 197 observations of adult butterflies.

The number of monarchs photographed each year has declined from a high of 75 observations in 2015 to an average of 55 a year in 2021 and 2022.  Since the number of iNat users and observations has increased more than 100x since 2014, it seems that the last 2 years represent more effort with less observations, indicating a possible decline in abundance.


For the adults, I annotated the observations using the Observation Field "Nectar / Pollen delivering plant" when I could ID the flower the monarch was observed on.  In some cases, the adult could be observed drinking nectar; in many other cases I assumed that a monarch adult resting on a flower was obtaining nectar.

In total, 71 adult monarchs appear to be drinking nectar from flowers that are identifiable to species or genus.  I documented 27 different plant species being used as nectar resources by monarchs.  This is a large diversity of plant species, considering that this data set included only 71 total observations of monarchs on flowers.

iNat link.

By far the most common plant species was Asclepias subverticillata, the common weedy milkweed species of northern AZ, and also a great plant for monarch caterpillars.  It is possible that some adults were just resting on the milkweed flowers in the process of depositing eggs on the plants, rather than drinking nectar.  Either way, clearly milkweed are important to monarchs.  This species is also popular with a diverse group of other pollinating insects.

Several aster species were also common nectaring plants, as well as butterfly bush (Buddleja), a planted ornamental that apparently lives up to its name!


Monarch presence in Northern Arizona is strongly seasonal, with most adults observed in late summer (August-September), so it is not surprising that some of the late summer Asteraceae such as Ericameria, Helianthus, Bidens and Heliomeris are popular nectar sources.  Since monarchs are generalist pollinators, this data could be consistent with opportunistic (no preference) nectaring.

However, there are many other common plant species flowering during September (such as Gutierrezia sarothrae, Dieteria canescens, Datura wrightii, Purshia stansburyana, Verbascum thapsus, Geranium caespitosum, Achillea millefolium), and no monarchs in this data set were observed nectaring on them. This suggests that monarchs do prefer certain species over others.


Also, there is the question whether the adults observed on flowers during August--October are migrating adults, mating adults, or newly metamorphosed adults.  Given that we do see caterpillars in September, and it takes about 30 days for a monarch egg to grow into an adult, it is likely that all three types of adults are making use of nectar resources in Northern Arizona.  


Caveats and Conclusions

Any mistakes or omissions are my own. I may have misidentified some flower species, but I don't think that would change the overall conclusions.

The small sample size limits the conclusions that can be drawn; more observations are urgently needed to better establish monarch plant preferences.  

Also, this data is subject to the biases of  the "citizen scientists" who use iNaturalist to document biodiversity.  They may be more likely to photograph monarchs on showy flowers, in areas near their homes (landscaped yards and ruderal/disturbed natural environments), and at convenient times of day.

Therefore, this study might be best used to help guide planting decisions to support monarchs in areas near where people live.


Acknowledgements

Thanks to iNaturalist user jdmore who created an excellent wiki explaining how to use the iNat search URLs to filter results, which was a crucial step to analyze this data.

Also, thanks to all of the iNaturalist community, including the 107 people who observed monarchs in the study area, and the 123 people who helped identify them.

Thursday, November 10, 2022

Is measuring biodiversity possible for non-experts?

I’m trying to measure pollinator biodiversity using iNaturalist, but I’m having doubts as to whether this is even possible for a non-expert.

Over the last five years I’ve photographed insects on flowers in my area, with the goal of creating a summary of total pollinator species per plant species per month. I'm using an Observation Field to associate the plant species with the insect Observation:  https://www.inaturalist.org/observations?place_id=1823&user_id=conorflynn&verifiable=any&field:Nectar%20%2F%20Pollen%20delivering%20plant=

I knew from the beginning that this would not be a perfect research study because I’m not systematically sampling the flowers with equal effort and equal time, and I knew I wouldn’t be able to ID every insect, due to the quality of my photographs.

But I hadn’t considered that the level of taxonomic ID could bias the total species counts. Even if I could ID every photograph to Genus, some Genera have dozens of species while others only have a few. Even worse, some taxa have more people helping ID and therefore have more detailed IDs, whereas other taxa have less interest and are stuck at Family level IDs.  

I think this makes comparing pollinator diversity difficult or impossible on iNaturalist. At best I could say something about how many different Genera or Families visit a particular species of plant --  but I’m not sure how important genera- of family-level biodiversity is...

iNaturalist is a great platform for documenting species observations, but now I think the utility of the data is taxa-specific.  For example, I recently went to a talk about rare talussnails and springsnails in AZ, and the speaker advocated using iNaturalist to document observations.  But how could he ID the rare species from iNat photos?  He just does it based on geography.  There’s no way to discover new snail species or new locations on iNat; DNA studies are needed for new populations to ID whether they are a new or existing species. 

I’d also hoped that I might be able to document new specialist pollinator-plant interactions, but I learned in The Bees in Your Backyard (the definitive bee ID book for North America) that even pollen specialists can be nectar generalists, so I don’t know how one would discover specialist interactions from photographs?  Do researchers have to analyze pollen grains on collected bee specimens??

Monday, November 07, 2022

Tree Risk - notes

 Notes from Tree Risk Assessment Qualification (TRAQ) class taught by Kevin Eckert for the Arizona Community Tree Council.  October 2022 


About 25 people are killed each year by falling trees in U.S.


Removal should only be an option when mitigations are not sustainable.  We have an ethical obligation to do no harm.  The benefits of trees are important.  


A risk is meaningless without a time frame.


Imminent - if a tear in the tree is weathered, the failure is not Imminent

Probable - failure would likely occur during normal (expected/seasonal) extreme weather.

Possible - failure would likely occur during abnormal (hurricane, tornado, derecho, etc) extreme weather.


Wounds

Thicker sap trees tend to compartmentalize better

If sap is oozing, touch and smell it:

Sticky = ok, its sap

Sour = bacteria

Slimy or foamy = fungus

Wet = just water


Drought

Tree dying from bottom up is over-irrigation

Tree dying from top down is drought (under-irrigation)


Failure

Soil failure vs root failure:  roots in air or roots break and stay in ground


Codominant is not a fault.  

Included bark is a fault because weak area doesn't hold stems.  

Aspect ratio near 1:1 for codom stems is a fault because don't have enough wood to wrap around union.  This is common cause of failure in pines, especially CA fire investigations.


Decay

Worse on compression side and at the base.  Hollow poles are strong. Most stress in tree is around the shell, so sapwood carries most weight, not heartwood (which is more brittle).

Heartwood - least concern

Sapwood - will start seeing tip dieback. 2nd worst.

Root - will also see tip dieback.  Not too bad if not structural; crown dieback will balance root dieback.

Basal - worst.  


Types of Response growth:

Reaction wood from tension/compression

Flexure wood from movement

Wound wood - e.g. lip around wound. More growth shows more stress


Likelihood of failure increases/decreases based on load (e.g. wind exposure) / response growth


Stress

Reproduction is sign of stress in trees (plants):  orchard trees cut to fruit more, but decreases lifespan.


Vigor/health does not always reduce tree failure risk

Adding N can increase leaf area and stem elongation, but that can increase load on stem and if stem doesn't thicken then can increase tree failure risk, even while increasing tree "vigor".  Sometimes reducing growth (ie use growth regulator) can improve mitigations.


Sheer plane: where tension and compression meet


Cracks: transverse (fiber failure) or longitudinal (with the grain)


Age

Old trees: retrenchment = natural process of aging, shortening and widening = more stable


Trees naturally move with wind.  Mass damping shows importance of inner branches and leaves.  Helps tree stems "undulate like snake in the wind".  Sharp bends or lack of inner leaf area can inhibit natural movement.


Construction

New concrete can leach lime/calcium oxate which raises soil pH and can harm some plants if too much


Adventitious branches = "water sprouts" (from topping = non ANSI cuts) = epicormic.  Poor attachments can rip out.


Shigo said:  "don't err on the side of safety….just do it right!"  :: Do the best you can based on your education, training, and experience.  

Wednesday, November 02, 2022

Arizona Monarchs Visit California and Mexico

 Five years ago my wife and I joined other local citizen scientists at Willow Lake for an enjoyable afternoon catching and tagging monarch butterflies.  The tags are small stickers with ID numbers.  They  don't impair the butterfly's ability to fly, but they do let us humans track where they fly to!


A monarch in the hand.

 The Southwest Monarch Study group recently updated their map showing the location of recovered tags.  The straight lines indicate starting and ending locations, not necessarily the meandering paths monarchs take to migrate across the landscape. 

Image from Southwest Monarch Study.  

  Over the ensuing years, those tagged butterflies have turned up as far away as the monarch's overwintering grounds in Mexico. Interestingly, they also visit California overwintering sites.  Most monarch populations can be neatly divided into Eastern and Western populations based on where they spend the winter; Eastern go to Mexico and Western go to California.  But it seems AZ monarchs can go to either, which raises the fascinating question: how do they decide where to go?  Is AZ a meeting spot for different populations, and each return to their home wintering sites, or is AZ a melting pot, a single population where individuals decide each year where to overwinter?

Hopefully this citizen science research will help resolve some of the question marks on monarch migration maps.

Monarch migration map from Xerces.


Monarch migration map from Monarch Watch. 


Monday, October 31, 2022

Fire Retardant Visible From Space

The Bush Fire started on the West side of Highway 87 in Arizona on June 13, 2020.  Drive by strong winds from the SW, it soon spread to the highway median and then crossed to the East side of the highway.  From there, it went on to burn 193,000 acres until it was completely contained on July 6, 2020.
Air tanker drops retardant ahead of fire.  Photo by JDH images.  https://wildfiretoday.com/tag/bush-fire-in-arizona/

Air tankers were extensively used in the initial attack on the fire, and Google Earth images of the fire start location show some interesting features.  These images were taken on June 20, 2020, 7 days after the fire had burned this location.

The fire started on the West side of 87.  Fire retardant strips are visible in several locations.

Where the fire was backing against the SW wind, retardant drops were successful in stopping the spread of the fire.  A small bulge near the top of the image shows where fire crossed the line, but was contained.

Retardant drops on the south side of the fire were not successful in stopping the fire, but may have been instrumental in slowing the fire which allowed it to be stopped at the dirt road.

Retardant drops directly in front of the wind-driven fire were not successful in holding against the onrushing flames.  The fire spread over and around the retardant line in this image.

At another location on the same date, the fire can still be seen actively burning.


Thursday, October 27, 2022

Is Forest Thinning Beneficial for Everyone?

 This Undark article says Pinyon jays are proposed for ESA listing because of forest restoration thinning:

“some bird biologists... are sounding the alarm that even today’s thinning methods degrade pinyon jay habitat. These woodlands are already under extreme drought stress, especially in New Mexico, with predictions for widespread loss due to climate change. And some studies suggest thinned piñon-juniper forests are less resilient to beetle infestation and drought.


 I participated in a 10-year monitoring study of thinned and unthinned Pinyon-Juniper woodlands in the Manzano mountains.  Our findings were different from those discussed in the study; we found increased soil moisture at thinned plots, which led to richer pinyon nut crops and an increase in pinyon jays.  


However, I'm not arguing that the cited studies are wrong; there may be important site-specific differences between different restoration treatments in different areas.    Some restoration can actually help pinyon jays, we just need to figure out which treatments, and how!

Hopefully, we can all agree that if a treatment isn't making things better for native plants and animals we need to rethink it; just because something is called "restoration" doesn't mean its automatically good.  That's why we need science like this.

Citation.

Wednesday, October 26, 2022

Upcoming Endangered Species Listing Decisions in Arizona 2022-2027

I found a 5-year workplan on the USFWS site and made a list of all of the AZ species that USFWS will make listing determinations for. 

Its pretty interesting to look at what’s coming up.  Lots of talussnails!  But after the Sonoran desert tortoise (which they decided not to list), I think the next big one is the Monarch butterfly.  

Also interesting that there’s no bumble bee species on this list, as I know they’ve been petitioned.  Of course, this could all change as new species are added to the candidate list and priorities change...


FY22

Sonoran desert tortoise

-widely distributed in AZ deserts

- listing decision spring 2022: not warranted


Cactus ferrugous pygmy owl 

-by end of calendar year

https://www.inaturalist.org/taxa/237012-Glaucidium-brasilianum-cactorum

https://www.audubon.org/news/this-tiny-desert-raptor-could-soon-regain-federal-protection


roundtail chub


gray wolf (western populations)


FY23

Joshua tree 


Quitobaquito tryonia


FY24

Monarch butterfly

-widely distributed in AZ

A listing proposal is anticipated by November 2023, with a final listing decision by end of Federal FY2024 (September 2024). 


Las Vegas bearpoppy Arctomecon californica


Pinaleno talussnail Sonorella grahamensis

San Xavier talussnail Sonorella eremita


FY25

Ferris's copper butterfly Lycaena ferrisi

https://www.inaturalist.org/taxa/1360320-Tharsalea-rubidus-ferrisi

ASNF southwest of Springerville


Chisos coral-root Hexalectris revoluta

Sky island mountains


Threecorner milkvetch  Astragalus geyeri var. triquetrus


Grand Wash springsnail Pyrgulopsis bacchus

Kingman springsnail Pyrgulopsis conica


FY26

Arizona toad Bufo microscaphus microscaphus

- widely distributed in AZ

https://www.inaturalist.org/taxa/64982-Anaxyrus-microscaphus


Navajo bladderpod Lesquerella navajoensis

- habitat on Navajo Nation


Yuman Desert fringe-toed lizard Uma rufopunctata


Mojave poppy bee    Perdita meconis 


Bylas springsnail Pyrgulopsis arizonae

Gila tryonia Tryonia gilae

Huachuca woodlandsnail Ashmunella levettei


Squaw Park talussnail Maricopella allynsmithi

-populations are on city or county parks in the Phoenix metro area https://explorer.natureserve.org/Taxon/ELEMENT_GLOBAL.2.114155/Maricopella_allynsmithi


Verde Rim springsnail Pyrgulopsis glandulosa

https://www.inaturalist.org/taxa/111425-Pyrgulopsis-glandulosa


FY27

Morton's wild buckwheat  Eriogonum mortonianum


Pipe Springs cryptantha    Cryptantha semiglabra


Source: https://www.fws.gov/media/national-listing-workplan-fiscal-years-2022-2027

More USFWS lists:  https://ecos.fws.gov/ecp/species-reports

Friday, October 14, 2022

Biodiversity on Prescott National Forest

 How many plant species are there in a geographic area?  Previously, I used iNaturalist to calculate total biodiversity for selected areas.  But this method is just a snapshot of the species currently recorded in iNaturalist.  In some areas, people may have already observed most of the biodiversity, while in other areas there may still be much more to discover.

One way to estimate the total unobserved biodiversity of a geographic area is to look at the timeline of species observations.  If more new species are being observed each year, there are likely still many more species to discover, whereas if the number of new species each year is declining, we may be able to fit a decay function that would predict the total number of species that will ever be observed.

iNaturalist offers a couple of ways to find lists of new species.  As an example, I will use the Prescott National Forest in AZ.

The first method: the API function recent_taxa.

According to this method, there have been 57* new plant species observed on the Prescott National Forest in iNat so far this year.  This is filtered for only research grade observations (quality_grade=research).  There are a lot of new observations by experts that just haven’t been confirmed by other experts. *For some reason this returns the species, genus, and family so to get 57 I subtracted repeated taxa (29) from total new taxa this year (86).

https://jumear.github.io/stirfry/iNatAPIv1_identifications_recent_taxa.html?place_id=130970&taxon_id=47126&hrank=species&order=desc&order_by=created_at&per_page=200&quality_grade=research

The URL code is pretty easy to modify for other places (PNF = 130970) and other taxa (plants = 47126).  Here is more background on API query terms: https://api.inaturalist.org/v1/docs/#!/Identifications/get_identifications_recent_taxa


The second method: download data.

 When searching observations for Prescott National Forest and filtering by plants, iNaturalist returns a page with summary statistics.   This can be downloaded and analyzed in Excel.

https://www.inaturalist.org/observations?place_id=130970&iconic_taxa=Plantae 

 After downloading the data:

1. sort the table from oldest to newest by the observation date column

2. select the whole table

3. use “remove duplicates”, and look for duplicates in only the species name column

The resulting list will show you the first observation of each species.  I then summarized the list by year and created this graph showing the year and number of new plant species recorded in iNaturalist for PNF.  


This method also sometimes returns other taxa than species, so the totals don't quite match between the website, the API, and this method.  Also, this graph is not filtered for only Research Grade observations, but it would look basically the same.  The graph appears to increase over time as more people use iNaturalist to record plant species on Prescott National Forest, up to a peak year in 2020.  Since then the number of new species seems to fall off, although it should be noted that 2021 was a drought year and 2022 isn't over yet.  


Wednesday, October 05, 2022

Biodiversity Phenology

 There are many ways to explore biodiversity using iNaturalist.  One way to study the biodiversity of a geographic area is with phenology:  the science of when things happen.


For example, it is possible to modify the search URL to find observations of plants within 100 km of Dublin, OH, to search for specific months.  The count of observations for each species give some idea of their abundance in that month.


Central Ohio's most common flowering plants in March.

Central Ohio's most common flowering plants in April.

It is interesting to note that the number of observations for e.g. Bloodroot (Sanguinaria canadensis) increase from March to April, but its relative abundance appears to decrease as Dutchman's Breeches (Dicentra cucullaria), Trout Lilies (Erythronium americanum) and other species are photographed much more in April.

Sunday, September 25, 2022

Where is most biodiverse?

 iNaturalist can be used to compare biodiversity in different locations.  

To do this, it is important to allow for different search effort in different areas: for example, a search of the middle of the Amazon might not return many species, not because there aren't many, but because people haven't observed them.

For the U.S., we will assume that search effort is at least somewhat comparable.  We will also look at total observations and divide them by total species to get some idea of the effort required to document a new species in that area.

We decided to investigate my home town in Washington State, Alexandra's home town in Ohio, one of our favorite places: Maui, and our current home in Arizona.

Port Orchard, WA

A 100 km search radius includes most of Puget Sound, the Olympic mountains, and Seattle.

Dublin, OH

A 100 km search radius includes most of central Ohio creeks, woodlands, agricultural lands, and all of Columbus OH.

Prescott, AZ

A 100 km search radius includes canyons and mountains between Flagstaff and Phoenix.


Maui, HI

A 100 km search radius includes all of Maui as well as ocean channels and nearby islands.


Summary Table


According to this analysis, Washington is most biodiverse, followed by Ohio, then Arizona, and in last place is the island paradise of Maui.  

Island biogeography teaches that islands, although unique for their level of endemic plants and animals, should be deficient in overall biodiversity if there hasn't been enough time for biodiverse taxa to colonize or evolve on the island.  This seems to be the case with Maui, which is especially depauperate in insects, given its tropical location.

Arizona, despite its diverse environments, is significantly lacking in Fungal diversity, which could be due to the arid climate.

The American Midwest, with its perfect seasonal growing climate, is remarkably biodiverse, and would probably surpass Washington if this search had included a more varied part of the Midwest with more mountains and/or rivers and lakes.

Washington tops the list as most biodiverse, probably because of the presence of diverse environments, with everything from alpine mountain tops to ocean kelp forests, and everything in between.  This is despite the lower number of insect species compared to a lower latitude place like Ohio.

A caveat to this entire analysis is revealed by the Total Observations in each area and the resulting Observations per Species.  While I had assumed that search effort would be equivalent across the US, it is evident that many more people are using iNaturalist around major cities like Seattle and Columbus.  Arizona is more sparsely populated and has many less observations, and Maui, despite the huge numbers of tourists, is even less populated.  This means that is only takes 20 or 27 new observations (on average) to observe a new species in Maui and Arizona, respectively, while it takes 47 or 72 new observations in Ohio and Washington, respectively, to observe a new species.  So even though Washington has the most observed biodiversity in iNaturalist, it may be easier to find new, previously-unobserved biodiversity in Maui or Arizona.


Thursday, September 22, 2022

Mapping Species Habitat with Appropriate-Sized Buffers

 Previously, I wrote that this Story Map shows small polygons of habitat as buffers around representative observations.  However, the actual locations are not accurate because the underlying observation data has been randomized to protect populations of rare species. 


The first map ("Preliminary Conservation Zones" and "Potential Dispersal Zones" for the American, Rusty-patched, Suckley's, and Western bumble bees) shows the correct kind of critical habitat (buffered observations) USFWS has designated for rusty patch and would likely designate for other proposed species, but the locations are incorrect.  For example, the mapped locations of Rusty patch on that map do not line up to the USFWS GIS for rusty patch critical habitat. 


Some of the other species may be are incorrect as well, depending on whether the data source (GBIF) considers the species endangered and so randomized the locations within a 0.2 degree lat/long box.  That seems to be the case for the Western Bumble bee, but not the American bumble bee. 


The map shows a mix of accurate and inaccurate, specific habitat points. This is confusing and potentially misleading, if the intent is to facilitate conservation planning.  For example, when I zoom to an area of interest, I might think there is no mapped habitat there. But if there is some nearby, I can't tell from if that habitat is or isn’t within my area of interest.


The easiest fix would be to increase the size of the buffers so that they include the entire randomized area (0.2 degree, lat/long) that each point comes from.  A note could say that critical habitat would likely be designated in a subset of those larger polygons based on the buffer size USFWS decides.

Monday, September 19, 2022

Rusty Patched Bumble Bee Critical Habitat


Rusty patched bumble bee range map.

USFWS listed the rusty patched bumble bee (Bombus affinis) as Endangered in 2017 due to a marked decrease in the range and size of populations across the Eastern U.S.  

As one of the first insect species to be listed under the Endangered Species Act, it offers an interesting case study for the way USFWS may approach other insects proposed for listing, including the Monarch butterfly, and numerous other bumble bee species.

From Xerces Society Listing Petition, 2016.

The listing petition states that "the rusty patched bumble bee probably needs floral resources to be located in relative close proximity to its nest sites, as studies of other bumble bee species indicate that they routinely forage within less than one kilometer from their nests ... although in some cases nearly two kilometers ... [It] is likely dependent upon woodland spring ephemeral flowers, since this bumble bee emerges early in the year and is associated with woodland habitats.....Rusty patched bumble bee queens are one of the earliest species to emerge, with observations as early as March and April."

Interestingly, rather than designate critical habitat based on the habitat needs of the species, USFWS chose to designate "High Potential" zones (e.g. critical habitat) as 1 mile buffers, and "Low Potential" zones as 4 mile buffers, around known (since 2006) sightings of the rusty patched bumble bee:


USFWS Map showing "High Potential" and "Low Potential" zones.  


Detail showing example 2x2 mile rusty patched bumble bee "High Priority" habitat in DeKalb, IL from USFWS map.  The buffered area seems to be based on a sighting at Prairie Park, and includes residential and industrial developments.  The only habitat in the area is within Prairie Park.  


USFWS has issued the guidance on whether consultation is required.  For vegetation management activities within the High Potential zones, the guidance provides the following test questions:
  • Is there habitat for nesting, foraging, and/or overwintering for the rusty patched bumble bee in the action area or will the proposed action restore habitat for the species in the action area? 
  • Will the action cause effects to vegetation in rusty patched bumble bee habitat in the High Potential Zone during the nesting period? Effects could occur as a result of mowing, cutting, grazing, prescribed fire, tree removal, spot-application of herbicide, tree clearing, and/or other activities. 

Based on this case example, it seems likely that USFWS will take a similar approach when listing other bumble bee species.  Specifically, it seems likely USFWS will only designate habitat immediately surrounding recently documented sightings, as opposed to using a general habitat model across the species' range.  Then, Section 7 consultation will be required for any activities that disturb habitat during the nesting period (i.e. growing season).

This seems to be the assumption underlying this Story Map, which shows small polygons of habitat as buffers around representative observations.  Note that the actual locations in this map are not accurate because the underlying observation data has been randomized to protect populations of rare species. 

This map of rusty patched bumble bee habitat around DeKalb, IL schematically shows the kind of habitat USFWS designated (i.e. buffered polygons around point observations) but does not show the accurate locations of the habitat because the data used for the map (GBIF) is randomized within 0.2 by 0.2 latitude/longitude rectangles.  

Thursday, September 15, 2022

Mitigation Banking Could Transform the Endangered Species Act

 The Clean Water Act (CWA) --despite its ambiguities-- has the important provision of acre-for-acre wetland mitigation. In other words, the CWA ensures No Net Loss of protected wetlands.

The Endangered Species Act (ESA) --despite controversies over Critical Habitat-- has no automatic provision of no net loss of protected species habitats. Instead, it relies on bespoke mitigations on a project-by-project basis. Most projects are approved with incompletely mitigated impacts to species and their habitats. The result is continual loss of habitat.

Current proposed changes to habitat mitigation could help make ESA more like CWA, moving the ESA toward No Net Loss of habitat. The result would be improved regulatory certainty for projects, mitigation banking opportunities for conservation investors, and better outcomes for listed species.

Environmental Policy Innovation Center's Becca Madsen has more excellent & detailed analysis.

Monday, September 12, 2022

Thistle Misidentification

Thistles are amazing flowers, but there are both native and nonnative invasive species in the Western US.  Some people who try to do good by removing nonnative thistles accidentally kill the native species as well. 

NM Thistle, Cirsium neomexicanum. My photo on iNaturalist. Link: https://www.inaturalist.org/observations/15024423

I worked with an AmeriCorps crew in the Sacramento Mountains (Lincoln NF) that had been removing musk thistles.  But I found out they didn’t know how to tell the difference between native and invasive thistles. 

Photo of musk thistle Carduus nutans from iNaturalist user c-guinan. Link: https://www.inaturalist.org/observations/132367683

Even worse, they didn’t even know that there is an Endangered species of native thistle in those mountains!  We investigated and it looks like they at least didn’t kill any endangered thistles, but it could have been really bad. 


Photo of Endangered Sacremento Mountains Thistle Cirsium vinaceum from iNaturalist user ck2az.  Link: https://www.inaturalist.org/observations/14433149

I’m currently trying to find the volunteers on the Prescott national forest who are pulling up all of the Arizona thistle along popular trails.  Its especially troubling to me when people who are trying to do good by removing invasive species end up destroying native species.

Arizona Thistle Cirsium arizonicum.  My photo on iNaturalist.  Link:  https://www.inaturalist.org/observations/87880049

Everyone who’s done natural resource work has stories of project missteps.  I don’t know how to prevent all mishaps, but talking about these misidentifications is a good first step.

The NM Native Plant Society has a great Thistle ID book written by Bob Sivinski.