Showing posts with label biodiversity. Show all posts

Saturday, January 31, 2026

DNA Barcodes, Klee Diagrams, and the Secrets of Speciation

Modern biodiversity detectives have found new ways to synthesize massive amounts of sequence data into clear information and insights. Two powerful tools to help visualize and understand the structure of life are DNA barcodes and Klee diagrams. Mark Stoeckle and David Thaler pioneered the use and explanation of these tools to offer insights into how species originated and evolved.

What is a DNA Barcode?

A DNA barcode is a short, standardized segment of the genome used for species identification. In the animal kingdom, the gold standard is a 648-base pair (bp) segment of the mitochondrial cytochrome c oxidase subunit I (COI) gene. While this segment represents less than one-millionth of an organism’s total genome, it has proven remarkably effective because mitochondrial DNA clusters largely overlap with species as defined by experts.

This tool is commonly used in eDNA samples to identify species from the environment. The BOLD (Barcode Of Life Database) now contains approximately five million of these barcodes, covering about 100,000 animal species. Interestingly, there is nothing inherently “special” about the COI gene biologically; it became the standard because reliable primers were adopted by a critical mass of the scientific community.

Visualizing Life: The Klee Diagram

To make sense of these millions of sequences, scientists developed the Klee diagram, a heat map that displays correlations between DNA sequences. In these diagrams, every sequence is compared with every other sequence, and the intersections are color-coded to show similarity. (Sirovich, Lawrence, Mark Y. Stoeckle, and Yu Zhang. “Structural analysis of biodiversity.” PLoS One 5.2 (2010))
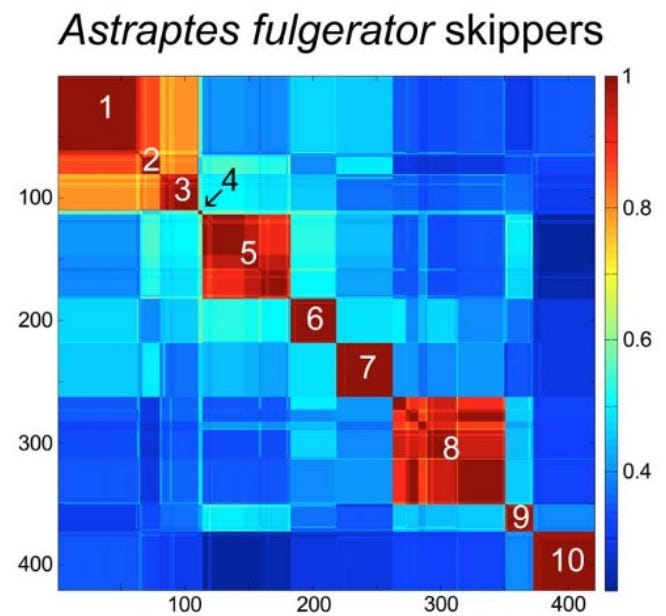
Species-level clusters in skipper butterfly Astraptes fulgerator COI barcode Klee diagram. Sequence clusters appear as blocks of high correlation along the diagonal and correspond to the 10 provisional species (1. INGCUP, 2. HIHAMP, 3. FABOV, 4. BYTTNER, 5. YESENN, 6. LONCHO, 7. LOHAMP, 8. SENNOV, 9. CELT, 10. TRIGO). Block sizes reflect number of sequences per species (n 3–88). Stoeckle and Coffran 2013.

Key features of Klee diagrams include:

• Indicator Vectors: Each DNA sample is listed on both the x and y axis and a heat map is generated comparing each species to itself (red=1, a perfect match) and all of the other samples in the database.

• Species Islands: When sequences are arrayed, species appear as sharp, non-overlapping squares. This visualization confirms that species are “islands in sequence space,” with distinct clusters and empty gaps between them.

• Scalability: Recent software developments like PyKleeBarcode allow these diagrams to be computed for very large datasets, potentially representing the whole animal kingdom in a single information space.
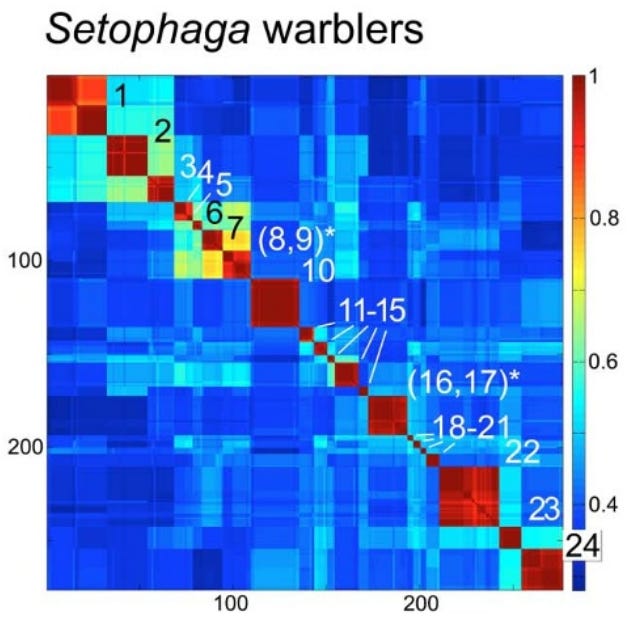
Species-level clusters in birds: Setophaga warblers COI barcode Klee. Blocks along the diagonal correspond to species; species with shared blocks are marked with an asterisk (1. petechiae, 2. striata, 3. pensylvanica, 4. nigrescens, 5. graciae, 6. discolor, 7. virens, 8. occidentalis,* 9. townsendi,* 10. magnolia, 11. tigrina, 12. castanea, 13. dominica, 14. palmarum, 15. citrina, 16. americana,* 17. pitiayumi,* 18. cerulea, 19. pinus, 20. kirtlandii, 21. fusca, 22. coronata, 23. caerulescens, 24. ruticilla). Stoeckle and Coffran 2013.

Evolutionary Implications: Why Mitochondria Define Species

A long controversy in biology concerns whether species are “real” or just human constructs. Dobzhansky, in his 1937 book Genetics and the Origin of Species, claimed that “Biological classification [of species] is simultaneously a man-made system of pigeonholes devised for the pragmatic purpose of recording observations… and an acknowledgement of the fact of organic discontinuity.”

Stoeckle and Thaler, in their 2018 paper “Why should mitochondria define species?”, expand on the evolutionary meaning behind these barcode clusters. They argue that the patterns seen in DNA barcodes are central facts of animal life that evolutionary theory must explain.

1. The “Barcode Gap” and Low Intraspecific Variation: Across the animal kingdom, the average pairwise difference (APD) within species is typically very low, between 0.0% and 0.5%. Meanwhile, the distance between even the most closely related species is usually 2% or more. This “gap” exists because intermediates between clusters are absent or rare.

2. The Neutrality of Synonymous Mutations: Most variation within and between these barcode clusters consists of synonymous substitutions; mutations that change the DNA sequence but not the resulting protein.

Stoeckle and Thaler argue that these changes are selectively neutral in mitochondria. This is because animal mitochondria are simpler than the nuclear genome; they lack introns (and thus splicing) and only have 22 different tRNA types. This lack of complexity means synonymous codons are less likely to affect the “fitness” of the organism, allowing them to accumulate as a “molecular clock”.

However, observed patterns of variation in DNA barcodes do not match the predictions of Kimura’s Neutral evolutionary theory of random accumulation of mutations.
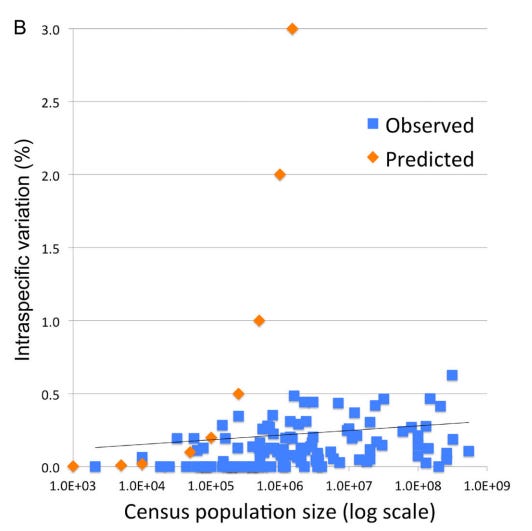
Intraspecific variation and population size among 111 bird species with census estimates; species with geographic or hybrid clusters were excluded. Orange markers indicate predicted variation for a model species under neutral evolutionary drift. Stoeckle and Thaler 2014.

3. A Recent Universal Expansion? To reconcile these observations, Stoeckle and Thaler’s use humans as a case example. Modern humans have an APD of 0.1%, which is about average for the animal kingdom.

Several lines of evidence suggest that human mitochondria originated from a state of uniformity approximately 100,000 to 200,000 years ago before expanding. Stoeckle and Thaler propose that the extant populations of humans, and almost all other animal species, arrived at a similar result due to a similar process of expansion from mitochondrial uniformity within the same recent geological timeframe.
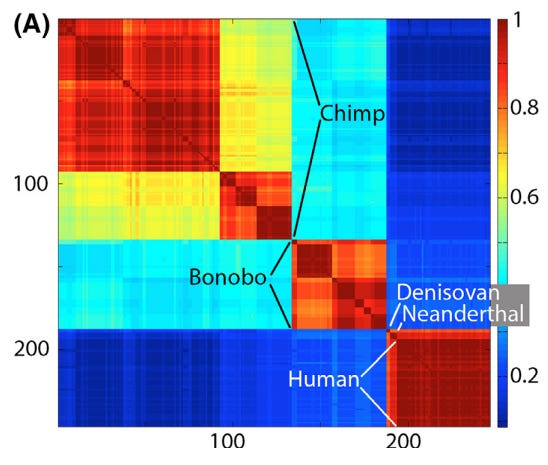
Klee diagram of mitochondrial genetic diversity of humans and our closest living and extinct relatives. The human sequences represent the span of known modern diversity. The Klee diagram heat map demonstrates greater mitochondrial diversity among chimpanzees and bonobos than among living humans. Thaler and Stoeckle 2016.

This coincides with Mayr’s 1942 idea that bottlenecks followed by expansion could explain speciation:

“The reduced variability of small populations is not always due to accidental gene loss, but sometimes to the fact that the entire population was started by a single pair or by a single fertilized female. These “founders” of the population carried with them only a very small proportion of the variability of the parent population. This “founder” principle sometimes explains even the uniformity of rather large populations…”
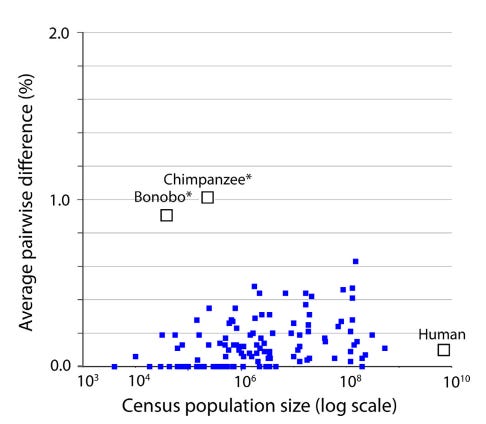
Mitochondrial genetic diversity, represented as average pairwise difference of COI barcodes, in relation to census population size in humans, chimpanzees, and bonobos compared to a well characterized set of birds (Stoeckle and Thaler 2014). Mitochondrial genetic diversity in humans is about 0.1%, less than that of many bird species, despite having more than 10-fold greater population than the most abundant bird in this dataset. Chimpanzees and bonobos have much smaller population sizes than humans, but conspicuously higher diversity, consistent with reproductively isolated subgroups. Thaler and Stoeckle 2016.

Conclusion

DNA barcodes and Klee diagrams do more than just identify species; they reveal a kingdom-wide pattern of organic discontinuity. Whether through population bottlenecks, lineage sorting, or gene sweeps, the uniform low variance across species suggests that the “islands” of biodiversity we see today are the result of deep evolutionary currents that affect all animals—from humans to birds to insects—in a surprisingly similar way.

Thaler and Stoeckler conclude their 2018 paper by noting that “there is irony but also grandeur in this view that, precisely because they have no phenotype, synonymous codon variations in mitochondria reveal the structure of species and the mechanism of speciation.”

Annotated Bibliography

Sirovich, Lawrence, Mark Y. Stoeckle, and Yu Zhang. “Structural analysis of biodiversity.” PLoS One 5.2 (2010): e9266.

- lays out math and originally defines “Klee diagrams”. Some examples.

Stoeckle, Mark Y., and Cameron Coffran. “TreeParser-aided Klee diagrams display taxonomic clusters in DNA barcode and nuclear gene datasets.” Scientific Reports 3.1 (2013): 2635.

- short and sweet version for Nature. Butterly and Warbler Klee examples.

Stoeckle, Mark Y., and David S. Thaler. “DNA barcoding works in practice but not in (neutral) theory.” PLoS one 9.7 (2014): e100755.

- first paper to note that the observed patterns in Klee diagrams, of homogenous species, doesn’t match neutral theory. OK.

Thaler, David S., and Mark Y. Stoeckle. “Bridging two scholarly islands enriches both: COI DNA barcodes for species identification versus human mitochondrial variation for the study of migrations and pathologies.” Ecology and Evolution 6.19 (2016): 6824-6835.

- short but good paper, cool data on humans, bonobos, and chimps, and comparison to results from their 2014 paper disproving neutral theory. Human/Chimp Klee example.

Stoeckle, Mark Y., and David S. Thaler. “Why should mitochondria define species?.” BioRxiv (2018): 276717.

- deep dive analysis that builds on 2014 observation that mitochondrial DNA barcodes don’t match expectations of neutral theory (”Species are islands in sequence space.”), while at the same time appearing to be created by neutral (synonymous) sequence changes. This is explained by evolutionary mechanisms of speciation, which has implications for how recent most species have become species. These results also help to resolve some of the disagreements about the definition of a species.

Duchemin W, Thaler DS (2023) PyKleeBarcode: Enabling representation of the whole animal kingdom in information space. PLOS ONE 18(6): e0286314.

- methods paper

Tuesday, September 30, 2025

Tortoise Population Zone Trends

Continuing my analysis of iNat tortoise and reptile data, I looked at whether the observed changes in proportion of reptile species encountered was different in urban and urbanizing zones.  I hypothesized that the continuing expansion of large cities in tortoise habitat could be contributing to their decline.

Methods

I downloaded iNat data for AZ reptile species and mapped the points in GIS. I only looked at full species instead of including named subspecies as I had in my previous analysis. Based on that previous analysis, it seemed possible that changes in subspecies identification could be accounting for some of the observed changes and I wanted to remove that potential source of bias.

I then subjectively defined polygons around the large urban zones of Phoenix and Tucson and used the Identify tool to add Phoenix and Tucson labels to all points within those areas.  Note that although the study area includes other towns in Arizona (such as Prescott and Flagstaff) I did not choose to define those areas as "urban". 

Phoenix urban zone.  220 total tortoise observations.
Tucson urban zone:  795 observations.

I also considered whether geopoint accuracy would impact the results, so I conducted the following analysis including and excluding points with no or low (greater than 1000m) accuracy.  However, because I did not see a difference I will simply present results for all data points (i.e. no geopoint accuracy exclusion).

Results: Urban Zones

The majority of tortoise observations are from urban zones, especially Tucson.


It is not possible to determine if more tortoises live around Phoenix and Tucson compared to remote areas; iNat data collection is opportunistic, so places where people live are more heavily sampled than remote areas.  This result is an important caveat to my previous results: iNat observation trends are most representative of urban zones and any observed changes do not necessarily represent changes in all areas of Arizona.


The proportion of tortoise observations has been increasing in urban zones, especially Tucson. From 2013-2025, although there is some noise early on (e.g. 2014) due to low observation counts, the general trend is apparent that Tucson increased from ~45% to ~55% of total observations, while areas outside metro zones decreased from ~40% to ~20%.

This could contradict my hypothesis (that tortoises are declining in areas of urban development), or it could be due to increased observers in urban zones.   


Reptile observations show the same overall trend of increasing observations in urban zones. The proportion of iNat reptile observations for Phoenix increased from 10% to 20%, Tucson increased from 30% to 40%, and non-urban areas decreased from 60% to 45%.

Reptile Observation Trends

I wondered whether the amount of urban versus non-urban observations could explain the changes I observed in reptile species observations.

Updated Reptile Observation Trends

The 26 species of reptiles with more than 1000 observations

There were 26 species of reptiles with more than 1000 observations in the study area.  They ranged from species with 100% urban observations (San Esteban Island Iguana, introduced) to species with 0% urban observations (Plateau Fence lizard).  The colored cells show population change from a 2018 baseline.  Look for areas of red-green or green-red, because those indicate consistent trends from 2013-2025.  Red for both indicate 2018 was a high point.  Green for both indicate 2018 was a low point.  

I then plotted % change against proportion of non-urban observations to look for trends and outliers.


First graph: The point at 100% non-urban and 50% change is Plateau Fence lizard, which is very common in Prescott and Flagstaff, maybe that area should be an urban zone.  The point above 200% change is sidewinder, maybe someone was studying them back in the day?

2nd graph.  The point at 0% nonurban and 180% change is the iguana, introduced in Tucson.

Conclusion

Urban areas do not have a consistent negative or positive impact on reptile observation trends. It would be interesting to look at observation trends of individual species in each zone, but most species do not have enough observations for a meaningful statistical analysis.

At this point I can conclude that the large and increasing share of iNat observations from urban areas definitely affects the analysis of reptile observation trends, but I have not been able to identify a consistent bias that this would introduce into my overall analysis.


Sunday, September 07, 2025

Reptile Trends in Arizona

Introduction
In my previous posts, I showed that the relative proportion of iNaturalist observations was decreasing for Sonoran Desert tortoises. 

In my second post I investigated whether there were biases affecting the total number of observations, and while I found some, they did not change the results of the first post.  However, in that post I only compared total observations to large taxa that include hundreds of species, like birds, insects, and reptiles.  The question remains of the variability of other individual species besides tortoises.  Is the observed trend in tortoise observations normal or extreme?  

Looking at other individual species is problematic, because while I could assume that the actual populations of large groups of taxa would be relatively consistent over time, that assumption does not hold for individual species.  In other words, it is harder to investigate potential observer biases when looking at individual species because their populations may actually be increasing or decreasing.

Nonetheless, looking at other species can shed some light on the observed trends in tortoise observations.  I looked at other reptiles with the idea that they might have similar trends, and/or similar causes explaining their trends.  

Reptile Observation Trends
I downloaded all Research Grade observations of reptiles within the tortoise study area and decided to focus on species with more than 1,000 observations over the 2013-2024 study period.  There were 26 species that fit this requirement.  

iNat page showing representative reptile species included in this analysis.  

I then conducted a similar analysis to the last blog post.  To look at the changing proportion of observations for each species over time, I divided the number of observations for each species each year by the total number of reptile and total number of non-plant observations for that year.  To compare species to one another, I normalized all species proportions to a base year, either 2013 (to look at % change since 2013) or 2018 (to look at % change since 2018).  

Changes 2013-2024
Excel can only graph 10 measures at a time (due to a limit on the number of colors?), so there are 3 graphs presented below for % change of various reptile species compared to total non-plant observations.  % change compared to other reptiles is not shown, but is summarized in the table below.

Top 10 lizards by total observations:

Plateau fence lizard had large initial increase that continued.
Western side blotched lizard had large increase in 2013 (year 11)
Common side blotched lizard has had increases, but ended very near where it began
Greater earless lizard decreased to 50% by year 5 and then held steady.

Middle 10 reptile species . Sonoran desert tortoise points are highlighted:

Mediterranean house gecko had large increase in first few years, but has decreased again since year 6 (2018)
Sonoran gopher snake has been up and down 50% at different times
All of the other species have decreased.

Bottom few reptile species. Note different Y axis:

Table of top 25 most observed reptile species in study area, listed from most to least observed:

Average change when normalized to total observations in less than 4%, but standard deviation is 50%.
Largest increase was Plateau Fence Lizard 240% change as a % of total observations, and 333% change as a percent of reptiles. Other species with large increases were red-eared slider and western side-blotched lizard.
Largest decrease was Gila Monster, only observed 38% as much in 2024 compared to 2013 total observations, or 52% as much compared to total reptile observations.  Other species with large decreases were Gopher snakes, western banded gecko, and Sonoran desert tortoise.  

The large variability in % change means that the standard deviation is also quite large.  Therefore, few if any of these changes would be statistically significant.   For example, even the large decrease in proportion of gila monster observations is not more than 2 standard deviations from the mean.

It is interesting to note that these results are largely consistent when species are compared against reptiles or all non-plant taxa.  Therefore this analysis does not help explain the apparent decrease of total reptiles compared to all non-plant taxa since 2013 that I noted in my previous blog post.


Changes 2018-2024

To show all species on one graph, I used Tableau to visualize the % change each species.  In this case I am comparing each species to total reptile species, but again I present comparison data for both total reptile and total non-plant observation in the table below.


Summary table:

Average change when normalized to total observations in less than 10%, and less than 1% when compared to just reptiles. but standard deviation is still more than 30%.
Largest increase was western side-blotched lizard with more than 200% change compared to either total non-plant or total reptile observations.   Other species with large increases were long-nosed snake with more than 150% change.

Largest decrease was still Gila Monster, which continued to decline since 2018.  It was only observed 50% as much in 2024 compared to 2018 when compared to total non-plant or total reptile observations.  Other species with large decreases were northern black-tailed rattlesnakes, sonoran desert tortoises, meditgerranean house geckos, and clark's spiny lizard.

Identifications to species versus subspecies can be a source of bias
The large increase in western side blotched lizard, a subspecies of common side blotched  lizard that did not show a large increase, could be due to Identifications favoring the subspecies.  Same could be true for Sonoran Gopher snake, a subspecies of gopher snake that showed a decrease.  The increase/decrease between the subspecies and species could be due to a cultural shift as identifiers increasingly favor the use of the subspecies.   Note that Northern black-tailed rattlesnake is also a subspecies (of Western black tailed rattlesnake), but almost all of the observations in AZ are consistently identified to the subspecies, so the large decrease in observations of this subspecies is probably not due to identifier bias.

Conclusions
While tortoise was not statistically different from all other reptiles, its decline is among the largest, grouped with other species of conservation concern.

For changes across reptiles, there are several possible hypotheses for the observed changes.  Some species are probably actually increasing or decreasing.  Species increasing in places people live would be observed more often.  But:  even if that is generally true, it is not consistently true.  Otherwise most common species would consistently increase and least common would consistently decrease.

I rejected my hypothesis that common reptiles are observed more and less common are now observed less frequently.  However, there does seem to be more variability in less observed species.  This is why I set the lower limit for this analysis at 1,000 total observations.  Even 1,000 isn’t very many, just 100-200 observations/year.  These small sample sizes could explain some of the variability.

Friday, September 05, 2025

Sonoran Desert Tortoise - Follow Up

In my previous post "Sonoran Desert Tortoise Population Status", I argued that a decline in the ratio of tortoise observations to total iNaturalist observations indicated a possible decline in the actual population of tortoises.  

However, that conclusion rests on the assumption that opportunistic "citizen science" observers have not changed their preferences in photographing other animals.  This could happen if people became less interested in tortoises, or if they became more interested in other taxa.  

Part 1: Trends in Other Taxa

I analyzed various other well-represented taxa in the iNat data to look for possible trends in observer preferences.  Specifically, I looked at all Research Grade (RG) iNat observations of amphibians, reptiles, insects, birds, and plants in the study area: 

Data table with total RG amphibian, reptile, insect, bird, and plant observations in the study area each year.

These are large taxa made up of many species and I expected that the ratio of observations would remain relatively consistent. 


Count of observations by taxa 2013-2024

Observations of all taxa have increased over the last 10 years, but some appear to have increased more than others. I divided the count of each taxa's observations by total observations to investigate proportional changes in the ratio of various taxa:

Ratio of various taxa to total observations 2013-2024

The ratio of various taxa has changed over time.  Specifically, the ratio of plant observations to total observations doubled in 2017.  
I don't think this could be due to an actual increase in the number of plants in AZ.  

Instead, I think this must be an indication of a changed bias toward plants, perhaps due to specific iNat users who focus on plants, or a general trend toward more plant-focused observers on iNat.  Plants, because they don't run away, are arguably the easiest organisms to photograph; it could be that as iNat has grown there are now more casual users biased toward photographing easier to observe organisms.  

Regardless of why iNat users are observing proportionally more plants, this appears to be a source of bias that should be corrected in my analysis.    

To correct for the large increase in plant observations, I compared various taxa to total non-plant observations: 

Ratio of various taxa to total non-plant ("total2") observations 2013-2024

This shows a fairly consistent observation ratios for the major animal taxa over the last 10 years.  While there is some year to year variability, there are no long term trends, except reptiles.  Reptiles in general are photographed 71% as often in 2024 compared to 2013. Most of this drop occurred from 2015-2017, with no major changes since then.  It is not clear why reptiles as a group declined in representation.  There are other reptile species of conservation concern besides tortoises and it is possible that reptiles actually are declining, or there could be other sources of observer bias in the data, similar to the trend in plant observations above.

Except for reptiles, all taxa ratios stayed within approximately +/- 15%:

Table: percent change in ratios of various taxa since 2013 and 2017.


Part 2: Another Look at the Tortoise Trend

The analysis in Part 1 led to a refinement in the total observation count used to create ratios, and helped set a baseline for expected change in ratios over the last 10 years.  I used this information to reassess the observed decline in ratio of tortoise observations.  

Tortoise observations were compared to various taxa and to total non-plant observations:

Percent change in the ratio of tortoises to various taxa and to total non-plant ("total2") observations 2013-2024

The ratio of tortoise observations has decreased since 2013 for all 4 animal taxa investigated, and for total non-plant observations.  The decline is remarkably consistent for amphibians, birds, and total non-plant observations ("total2"), and fairly consistent for insects.  The ratio of tortoise to reptile observations tends to fluctuate over time, while maintaining the same overall negative trend.

While most animal taxa ratios show less than 15% change from baseline (Part 1), tortoises are observed 66-84% (mean 72%) in 2024 compared to 2017, and 35-57% (mean 43%) in 2024 compared to 2013:

Table: percent change of tortoise observations to various taxa and to total non-plant observations.

Conclusions

Tortoises show large declines compared to various representative animal taxa and compared to all non-plant observations.  This is the same result I found in my original blog post when I compared tortoises to all observations.  

The result was not affected by removing a potential source of user bias, showing that the original result is robust to some observational biases.  Of course, there will always be more sources of bias that could be analyzed and corrected for.  However, the fact that correcting for one source of bias didn't change the result makes me somewhat more confident that this result is directionally correct.

Conversely, the fact that I did find a large source of observer bias makes me wonder whether there are other large biases in iNat observation trends.  Without analyzing all sources of bias (why did reptiles change in 2017?) these results must remain clouded by potential uncertainties.  

The result was also not affected by which taxa I compared tortoises with, showing that the original result is robust to choice of comparison.  Tortoises appear to be declining, whether they are compared to all observations, all animals, amphibians, reptiles, insects, or birds.  While it is possible that one or more of these taxa are affected by observational bias, the fact that they all point in the same direction makes me more confident that this result is directionally correct and reflects an actual downward population trend.

Saturday, August 30, 2025

Sonoran Desert Tortoise Population Status

 Abstract

Population trend data for species under consideration for federal protection is often limited. This study evaluated Sonoran desert tortoise (Gopherus morafkai) population trends in Arizona using iNaturalist citizen science data. We analyzed 1,402 research-grade tortoise observations and normalized them against total observations in the area to account for sampling bias. While both tortoise observations and total observations increased since the early 2010s, the ratio of tortoise to total observations declined consistently from 0.12% to 0.08% between 2017-2025. This decreasing ratio suggests either shifting observer preferences or declining tortoise encounter rates, potentially indicating population decline. These results provide concerning evidence of negative population trends for this species of conservation concern and demonstrate the utility of citizen science data for monitoring species lacking formal survey programs.


Introduction

Sonoran desert tortoise (Gopherus morafkai) live in the Sonoran desert of Arizona and northern Mexico.  A closely related species in California and Nevada, the Mojave desert tortoise (Gopherus agassizii), is Federally protected as a Threatened species under the Endangered Species Act (ESA).  The Sonoran desert tortoise is listed by AZ as a Species of Greatest Conservation Need (SGCN) and was proposed for protection under the ESA but determined "Not Warranted" in 2022.  On June 4, 2025 wildlife groups filed suit in federal court challenging that determination.  

It is difficult to find current population trend data for species that may warrant listing under the ESA, so I attempted to do so using publicly available iNaturalist data.  iNaturalist is a public repository of photographic observations of species.  

Methods

I filtered iNat for Research Grade observation of Sonoran desert tortoises in AZ and found 1,402 observations. I considered limiting the analysis to only live tortoises, but eventually decided to use all research grade observations due to the difficulty filtering. Only ~3% (44 observations) were annotated as dead , and only ~1% (12 observations) were annotated as scat.  

I created an Area of Interest (AOI) bounding box around the tortoise data to search for total RG observations.  There were a total of 1.2 million RG observations in the Sonoran desert of southern AZ.

RG tortoise observations in AZ with bounding box showing AOI.  

More tortoises are observed in places where there are more people to observe them.  Because iNat data is based on opportunitistic data collection, it is liable to biases based on where people live as well as how many people use iNat.  To attempt to correct for this, trend analyses can normalize the count of tortoise observations as a ratio of total observations in the AOI.


Data

Data table of AOI with Total RG Observations, Total Observations, RG:Total Observations Ratio, RG Tortoise Observations, and RG Tortoise: RG Total observations.


Results

Total RG observations in the AZ Sonoran desert have been increasingly consistently since the early 2010s.

Count of total RG observations in the AOI per year.

Tortoise observations have increased since 2013, with some notable dips in 2020 and 2023. It is possible that these dips are due to weather-related impacts to tortoise population, but they could also be due to differences in number of observations.  


Count of tortoise observations per year.

By comparing tortoise observations to total observations, a normalized ratio can be derived. This ratio decreases over time. There is a step change decrease in 2017, which could be a real population decrease or could be due to the huge increase in popularity of iNat in 2017.  However, even if only looking at 2017 -2025, there is still a long term decrease in the ratio of tortoise observations, from around 0.12% to 0.08% of total observations. 


Ratio of tortoise observations to RG observations. 


Discussion

The decreasing ratio of tortoise observations indicates that either people are trending to preferentially observe other species more than tortoises, or that tortoises are making up a smaller percentage of the animals people encounter.  

Despite limitations of citizen science data, these results provide concerning evidence of negative population trends for this species of conservation concern and highlight the utility of iNaturalist data for monitoring species that lack formal survey programs.

Wednesday, January 22, 2025

iNat Isn't Slowing Down in Arizona

The iNaturalist website collects species observations from people all over the world.  It started in 2008 and grew slowly at first and then entered a period of rapid growth in 2017.  As a consequence, the number of species recorded on the website is constantly increasing, passing 300,000 in 2020.  The website is currently adding more than 50 million observations a year. This raises an interesting biodiversity question: how long can the number of species keep increasing?  Another way of stating the question: how many species are there?

Biodiversity scientists use species accumulation curves to estimate the total number of species in a given area.  As they investigate a new study site, they record new species and the date/time the species was observed.  For most sites, the number of new species increases rapidly as scientists describe common species; the number of new species slows as scientists search for more and more rare species.  Graphing the number of species over time should reveal a logarithmic curve.  Based on the equation for that curve, scientists can estimate the asymptote - the number of species the curve will eventually reach given enough time.  This allows scientists to estimate the total number even if they don't finish counting all of the species.


This slowing down does seem to be happening for total species count on iNat.  For example, the 2024 Year in Review showed 50 million observations over the year, and about 1,000 new species (not previously observed and posted to iNat) per month.  

From iNat 2024 Year in Review

In contrast, back in May 2019 more than 6,000 new species were added.  It appears that 2019-2020 was the peak for adding new species, and even as more new users have joined iNat, fewer and fewer new species are being observed.  

These charts show running totals, with new additions colored, so that the logarithmic curve is more visible in Newly Added Species:

From 2024 Year in Review

There were fewer observations and many fewer users in 2019-2020, than now, but the rate of newly added species was much greater.  This appears to indicate that it is getting harder and harder to find new species to add to iNat.  Observable species on iNat are those that can be distinguished with photographic evidence, usually limited to smartphone cameras.  So this estimate does not include microbial life, and probably excludes most microscopic life.  

Its possible that unobserved species are mostly in the middle of remote wilderness areas and that is why fewer and fewer are being observed.  But many of the new species are from the US and Europe - there's still lots to explore!

For example, in Arizona the species accumulation curve is still effectively linear, with about 700 new species each year.  No signs of slowing down here!


The same is true of smaller areas within AZ, for example the Prescott National Forest averages 186 new species observed each year.  

I considered whether the new species could be due to rare birds and insects showing up for the first time.  I also analyzed new plant taxa on Coconino National Forest.  Plants are well-studied and the forest has been extensively surveyed, so it seems unlikely that new species would be discovered yearly.  But, according to the iNat data, not only are new species being continuously discovered, there is no detectable slow down in the rate of discovery!


I'm not sure what conclusions to draw from this analysis.  The standard conclusion would be that we haven't sampled enough species yet to begin to see the rate of new species discoveries slowing down.  This implies that the total number of species is quite a bit greater than the number that have been recorded so far on iNat.  

Another interpretation could be that the actual number of species isn't constant.  In other words, there could be new plants showing up each year on the Coconino.  This could be due to new invasive species, shifting distributions of native species.  It could also be impacted by taxonomist naming conventions; the number of species in even well-explored areas could increase as botanists work to name and describe the huge floristic diversity of the world.

There is still a lot of biodiversity to explore, even in our backyards!

Friday, December 22, 2023

Saving Biodiversity is Essential to Stop Global Warming

This simple message -that we can't save the Earth without saving the actual physical, water-and-soil-and-plant Earth- needs to be said and re-said until everyone understands.  

We've been disappointed by the scientists, leaders, and especially the "environmentalists" (like Sierra Club, Audubon, Union of Concerned Scientists, etc...) who have decided to advocate for industrial "renewable" energy as the only solution.  They've looked at the massive environmental destruction required to mine, manufacture, and construct solar and wind farms and connecting transmission lines - and said yes, we must destroy the world to save the world.

However, there is hope within the current system.  The push to save biodiversity, while sometimes sidelined, has significant support in the COP15 agreement.  That agreement, and related work by TNFD, will have to be considered, often for the very first time, by every company and gov't with sustainability disclosures.  

Even the IPCC addresses the importance of land use - the latest AR6* still shows global photosynthesis absorbing net carbon every year, despite human land-use change continuing to destroy that literal lifeblood of our planet.  

All numbers are gigatonnes of Carbon.  Image Source: Hillis, David.  Life: The Science of Biology.  Textbook published 2020 by Macmillan Higher Ed.  

According to the diagram above, net plant growth (photosynthesis - respiration) stores 3 gigatonnes/year of carbon, offsetting almost 1/3 of the yearly emissions from fossil fuels (9.5 gigatonnes/year).  However, human-altered land use and human-caused fires emit another 2 gigatonnes/year of carbon to the atmosphere.   A gigatonne is about twice the weight of all the humans in the world. (Source: https://energyeducation.ca/encyclopedia/Gigatonne)

Also, the upcoming (in 2024) standards for including land use change in Scope 1/2/3 emissions reporting will explicitly tie real environmental destruction (clearing forests, bulldozing farmland) to the statistics that accountants love to worship, total tons of carbon emitted.  Now developers (even of renewable energy) can't ignore the cost that continued industrialization has to the Earth's life-giving ability to absorb and store carbon.  

Source: https://ghgprotocol.org/land-sector-and-removals-guidance


Hopefully, with all of these connections being made, people will finally start to give credit where credit is due, and give thanks to our beautiful, fragile planet for all it does for us.


*IPCC overview diagrams of global carbon sinks and sources:

 AR6 (2023) : https://www.ipcc.ch/report/ar6/wg1/figures/chapter-5/figure-5-12/

AR5 (2013) overview: https://www.researchgate.net/figure/Simplified-schematic-of-the-global-carbon-cycle-IPCC-2013-Numbers-represent-carbon_fig4_281185559

AR4 (2007) overview: https://www.researchgate.net/figure/The-global-carbon-cycle-boxes-are-carbon-pools-and-the-arrows-the-fluxes-between-them_fig2_255642401

Sunday, November 05, 2023

Which State has the MOST ticks?

 Ticks spread a number of diseases, plus they are disgusting and annoying.  But which areas have the most?  Where do hikers need to take precautions?  Models have attempted to create "heat maps" showing when and where ticks are most abundant.  Another approach uses citizen science data:  where do people report seeing the most ticks?

I used iNaturalist data to compare relative abundance of ticks in several US states.  iNaturalist users post photos of observations on the website, which can be easily queried in the Explore tab.  However, some areas of the country have many more people using iNaturalist, so it is necessary to standardize the data by dividing by the total number of observations in each area.  This creates a metric of the relative abundance of tick observations compared to total observations.  

Another potential confounder is if some people specifically observe as many ticks as possible.  This could skew the results if one state had someone obsessed with tick photography, and another state didn't.  I corrected for this by subtracting observations from the #1 tick observer in each state.  Only one state (CA) had this problem.  This correction did not substantially change the results in CA, or any state.  

Data compiled from iNaturalist.org

The state/area with the most reports of ticks was California, but CA also had the greatest total number of observations of all life forms.  When corrected for relative abundance, CA is near the middle of the distribution.  Hartford, CT, famous for its tick abundance, topped the list.  Arizona and Washington had the lowest relative abundance.  Other top areas included MA, CT, ME, PA, and NY.