Showing posts with label quantified. Show all posts

Thursday, September 26, 2024

Nutritional Yeast contains variable amounts of B vitamins

Nutritional yeast is tasty and nutritious!  How nutritious is it?  Well, that depends on whether it is fortified or not, and how much information you find on the nutrition label.  

After looking at the labels of about a dozen brands, I found that nutritional yeast is consistently a good source of B2, B3, and B5, and with fortification is a great source of all major B vitamins except probably B7.

Fortified nutritional yeast contains extra B vitamins and sometimes iron. These extra nutrients are added during the processing of the product to make it more nutritional.  The vitamin content of fortified nutritional yeast depends on how much it is fortified.

For example, here are two popular brands, Braggs and Bob's Red Mill:

% Daily Value (DV) per 2 tablespoon serving. Data reported from nutritional labels.

Both brands add supplement B1, B2, B3, B6, B9, and B12, but they add different amounts.  In general, both seem to try to add more than 200% and less than 500% of the daily value.  Bragg adds more of most B vitamins, but Bob's Red Mill adds more Folate (B9).  Neither brand reports any B5 or B7, but that doesn't mean they don't have any.  According to my analysis of unfortified nutritional yeast, they probably just didn't bother to measure and/or report it.

Non Fortified or Unfortified Nutritional Yeast contains only the vitamins and minerals found in the yeast cells and has no added vitamins and minerals.  It contains variable amounts of B vitamins due to differences in yeast strain, growth substrate, growing conditions, and deactivation temperature.  

While some brands (like Anthony's) don't report any nutritional values, I was able to find 7 brands on Amazon that reported nutritional testing results for their products:

% Daily Value (DV) per 2 tablespoon serving, data reported from nutritional labels.

Note that unfortified nutritional yeast does not contain B12.  For other B vitamins, the percent daily values are generally less than 100% and usually less than 50% per 2 Tablespoon serving.  

Another way to visualize this information is by Brand:

% Daily Value (DV) per 2 tablespoon serving, data reported from nutritional labels.

Microingredients and Naturebell are the most consistent.  Sari reports the least number of vitamins.  Food Alive reports some very high levels but also some very low levels.  Revly is also missing several vitamins.  They also reported more than 400% B2 but I removed this outlier; it may have been due to testing fortified nutritional yeast by mistake.

The differences between brands are larger than the similarities.  Some brands reported zero or almost zero B1, B2, B6, and B7.  Conversely, other brands reported over 100% DVs of B1, B2, B5, and B6.  Only B3 and B5 were consistently reported with decent amounts across all brands.  

If we assume unreported values are not zero but were just not measured and look only at the vitamins reported by each brand, the mean vitamin content of unfortified nutritional yeast looks pretty good.  However, the standard deviations are as large as the reported values for 4 of the 7 B vitamins.  While some brands are good sources of B1 and B6, some were quite low for these nutrients.  It seems that unfortified nutritional yeast can only be relied on to supply more than 20% daily value per serving for B2, B3, and B5:


Note that all of these unfortified nutritional yeast brands contain B5, so it seems likely that fortified nutritional yeast brands also contain this important nutrient and simply fail to test and/or report it.  However, the percent daily value for B5 is much less than that of other B vitamins in fortified nutritional yeast.  

Four of the seven unfortified brands reported B7, so it is likely that the other unfortified and fortified brands also contain this nutrient, but fail to test and/or report it.  However, even the brands that report B7 report such a small and variable amount, nutritional yeast probably cannot be relied on as a good source of this important vitamin.


** Update **

I reached out to Sari Food to ask if their package listed nutritional values for all B vitamins, or if some were omitted.  They confirmed that some were omitted and provided me with a new nutritional analysis that differed significantly from the nutrition reported on the package.  

The new analysis reported 7 B vitamins, compared to the package that only lists 3.  Their analysis showed significant amounts of B1 and B7 that were not listed on the package.  Interestingly, the new analysis also differed from the package for the 3 listed on the package.  I think this shows the variability between different batches of the same product. 
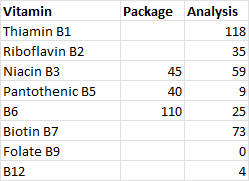
% DV of B vitamins for Sari Nutritional Yeast

Revised Figure showing % DV by brand:


These results increased the average % DV of the 7 brands in my sample for B1 and B7, and decreased the % DV for B6.  This now shows that unfortified nutritional yeast are generally good sources of B1, B2, B3, B5 and B7.  B6 appears to be less common, and I'm not confident that the B9 data is accurate - Sari's new analysis still didn't report any Folate.  Unfortified nutritional yeast is not a good source of B12.

Updated with new analysis from Sari Foods.


Wednesday, August 07, 2024

How Accurate Are Digital Thermometers?

I wanted to know my temperature, so I would know when I have a fever.  I was also curious how my temperature compares to "normal" people.  

But first, I had to figure out how accurate my digital thermometer is.

Accuracy is how close a measurement is to the true value; precision is how much variability there is in repeated measurements.  The thermometer says it is accurate to within +/- 0.2 F, but I have no way to test that because I have no other measurement of my temperature to compare it with.  I can test the precision by taking multiple readings in a row.  This usually yields the same number, indicating that the precision is very good (i.e. low variability).  However, sometimes, depending on how I hold the thermometer, the readings can vary by as much as 0.4.

What is my normal temperature?  

To test this, I took my temperature over 10 days in April, 2024.  I took 48 readings, a total of 3-4 for each hour of the day.  For each reading I lay down for a minute and then put the thermometer in my mouth, as far back under the tongue as possible.  Each reading took 90-120 seconds, so this effort included more than an hour of total time spent taking my temperature.


My average temperature is 97.4, almost a full degree less than the widely-quoted population average of 98.2.  Standard deviation is 0.6 degrees, so 68% of the time my temperature is between 96.8 and 98.  This variability include any precision variability in the thermometer.

My temperature usually reaches a minimum in the morning, rises to a maximum is in late afternoon / early evening, and then begins to fall before bedtime.  My highest temperatures were recorded after exercise, doing chores, eating a warm/fatty dinner, and lying in the sun.  Minimum temperatures were recorded lying in bed, after exercise, and after breakfast.  

Wednesday, October 13, 2021

Overnight HRV: Comparison of PPG to ECG

Problem:  Short-duration morning HRV measurements may be susceptible to exactly when you wake, your HR, breathing rate, thinking about work etc in that moment. Different apps report widely different values of HRV.  Perhaps more importantly, morning snapshot measurements do not record HRV over a physiologically meaningful interval.  The best case would be to record HRV 24-7, but this is not feasible with current wearable technology.  However, wearables can and do report night time HRV.  At least this is measuring vagal balance over a physiologically meaningful interval, namely, the sleep recovery timeframe.


Methods: recorded overnight HRV using Polar H7 chest strap connected to the iOS app HRV Logger, for 12 nights over more than a month.  HRV Logger stopped recording on 2 nights, perhaps due to loss of connection with the H7 or other errors, so I have 10 nights of complete data.  The Polar H7 chest strap directly measures electrical activity (ECG) and is considered the gold standard for at-home HRV measurements.  

I also wore a Fitbit Inspire 2 each night and downloaded the data file from Fitbit.com at the end of the month.  Fitbit uses a green light PPB (photoplethysmography) sensor to measure blood flow changes at the wrist and infer heart rate and HRV.  

HRV Logger was set to 5 minute recording windows and RR-interval correction was set at 25%.  Fitbit also reports HRV in 5 minute recording windows.  However, the 5-minute interval windows are only approximately aligned as they are based on offset starting times.  HRV is reported as rMMSD.  


Results:  At this point, I am reporting preliminary data from 3 representative nights.  


Night of 9/19


Summary


Fitbit

Polar

mean

38.5

41.48

std dev

6.75

8.44


Night of 9/21


Summary


Fitbit

Polar

mean

39.82

44.32

std dev

6.94

9.23


Night of 9/28


Summary


FitbitInspire2

PolarH7

mean

35.06

39.57

Std dev

5.31

7.80


Conclusion

An examination of the time course data shows that Fitbit was able to pick up the broad changes in HRV during the night.  It appears Fitbit misses spikes in HRV that the Polar strap is able to detect.  Although it is also possible that the Polar strap is biased by movement artifacts, it seems most likely that either Fitbit is not sensitive enough to detect short-duration changes in HRV, or a Fitbit error-correcting algorithm is too aggressive at removing short changes in HRV.

In addition to being less sensitive to variations in HRV (as measured by standard deviations), Fitbit also consistently records a lower average nightly HRV than the Polar strap.

The overall R squared value is only 0.38, however this statistic probably underestimates the correlation of time series data due to the fact that the 5-minute windows are not perfectly synchronized.  Even so, R squared of 0.38 is a higher correlation that I was able to achieve using the Polar H7 with 2 other apps.   


Wednesday, September 08, 2021

Fitbit Data Analysis: HRV and Temperature

 Comparison

Between April/May 2020 and August/September 2021....

    .... my resting HR went from average 52.4 to 55.3

    .... my deep sleep went from average 75.6 to 91.5 minutes


Nightly HRV analysis

Night of Sep 4-5th:  Morning HRV was 62 in Elite HRV, 82 in ithlete, 41 in Fitbit, and 64 in HRV logger.  


Night of Sep 5-6th: Elite HRV was 66, ithlete was 82, Fitbit was 51, HRV logger was 54.  94% of time HR was below resting.  


Sep 6th-7th (but only 6th is shown, due to not downloading Sep 7th data yet...)

Comparison of cheststrap (30 sec sample data smoothed to 5 minute window, Fitbit HRV sampled on 5 minute intervals).  Fit looks pretty good.


Recently found out Fitbit records temperature as well.  There is a diurnal rhythm, with interesting variations.  Sep 4th and 7th were both early morning outdoor exercise (jogging and hiking, respectively).  


More temperature details:

The Inspire 2 temperature sensor is at least directionally-accurate!

The nightly data ("Computed Temperature" file) has what looks like temperature in Celsius. For me, it is 31-32 Celsius at night, which is around 90 F. This is the data that is reported as Skin Temperature in Health Metrics.

Interestingly, there is also continuous 24 hour temperature data at 1 minute intervals ("Device Temperature" file). This data appears to be recorded as variation (+/-) from some baseline, as the numbers are always between +3 and -8 for me. Again, probably Celsius. I plotted my data from the last few days, and the times when I was exercising outside in the sun were consistently +2 degrees above other times that I would guess were cooler.

I don't know if the temperature measures are absolutely correct, but they do at least make sense and could potentially be used to identify unexpected temperature anomalies.

If anyone else is trying to download their data, note that you have to request it on the Fitbit account setting website, and then confirm the email.


Tuesday, June 16, 2020

Sleep Apnea: Research and Self-Experimentation Results

 Abstract

I tested several sensors that claim to measure sleep apnea through optical measurement of blood oxygen content.

Background

Blood oxygen arterial saturation (Sa02) is approximated by Sp02.  At 5,000 feet elevation, Sp02 should be above 92%. Values under 90% are considered low.  Hypoxemia is dangerously low blood oxygen, defined as Sp02 <88% for more than 5 minutes.   (Hypoxia is low tissue oxygen levels)

An oxygen saturation level over 95 percent is considered normal. Anything below 92 percent oxygen may be a sign of breathing problems during sleep, such as sleep apnea or another disorder like severe snoring, COPD or asthma.  (Low levels can also be caused by anemia.)

Sleep apnea is characterized by a cessation of airflow lasting 10 seconds or more. Hypopnea (shallow breathing resulting in desaturation) is a decrease in airflow lasting 10 seconds or more with a 30% oxygen reduction and a 3 to 4% desaturation from the baseline. It is not uncommonpatients with sleep apnea to desaturate below 88%. 

Note: low Sp02 is an indicator of sleep apnea and is not necessarily the mechanism of the bad effects.  It may be possible to not have hypoxemia, but still have interrupted sleep.  

Sleep apnea and hypopnea can cause small awakenings that disrupt normal sleep cycles.  This can cause irregular heart beats, high blood pressure, blood sugar excursions, strokes, heart attacks, etc.  Most common effect is to create chronic, elevated stress response.  

Results

- Fitbit Charge 2 never showed any apnea episodes

- Biostrap showed several, including some that my wife didn't remember

- Wellue 02 ring showed several mild episodes per night.  Based on other testing, this sensor seemed potentially the most accurate, but location on finger wasn't comfortable.  Also ended up not being accurate because I sometimes sleep on my arm, cutting off circulation, which reduces Sp02.

Conclusion

I have been diagnosed with mild sleep apnea and my wife has no known apnea.  We both tried the Sp02 wearable sensors and they consistently showed the same level of apneas between us, either none (Fitbit) or mild (Wellue 02 Ring).  Based on the lack of a clear and actionable signal from these sensors, I no longer use them to track apnea events.  Instead I focus on trying to minimize possible breathing issues and promote general good sleep hygiene to try to improve restfulness. 


Sunday, May 31, 2020

Blood oxygen concentration during Wim Hof breathing

 Here is some interesting data:  Blood oxygen concentration and heart rate during three cycles of Wim Hof hyperventilation and breath holding.

Total elapsed time 14 minutes.  3rd breath hold I went two minutes and bottomed out the blood O2 meter!


Method: 

Followed "Guided Wim Hof Method Breathing" video on Youtube.  

Used Wellue O2 Ring Blood Oxygen Monitor to measure blood oxygen. I tested several wrist spO2 monitors and this finger spO2 monitor is much faster and more accurate. 

Saturday, May 23, 2020

HRV "Resonant Frequency" Test

HRV is often used to assess relaxation and recovery, but it is not clear if it correlates with R&R, or somehow causes it.  I think the claim is that it causes it, because HRV is supposed to directly reflect autonomic activity, with higher values indicative of more balanced sympathetic and parasympathetic activity.  (But some recovery scores are calibrated to not let the score get too high all at once.)

But HRV is very susceptible to intentional breathing frequency.  This can be good or bad, depending on whether this manipulation is considered functional or just gaming the system.  

HR naturally slows on the exhale, and speeds up on the inhale, reflecting the dominance of parasympathetic and sympathetic systems, respectively.  By adjusting the frequency of breathing to be resonant with some natural rhythm, HRV can be increased optimally.

I tried breathing rates from 4.5 to 6.5 breaths/minute (at 0.5/bpm steps) and found 5 breaths/minute (=6 seconds in, 6 seconds out) to be optimal for increasing my HRV.  This is my personal optimized meditation breathing frequency for reducing stress.  

HRV is greatest when I take belly and chest breath deep in, then really relax completely on breath out.


Tuesday, April 05, 2016

Portable Real-Time Measurement of Air Quality

I recently purchased a Uni-Trend Air Quality Meter.

It measures VOCs (both natural and man-made), PM2.5, and temperature and humidity.

Coarse particles (PM10) have a diameter of between 10 micrometers and 2.5 micrometers and settle relatively quickly whereas fine (PM2.5) (0.1 to 2.5 micrometers in diameter) particles remain in suspension for longer. To put things into perspective, human hair has a diameter of 50-70 micrometers and a grain of sand has a diameter of 90 micrometers.


Sources of fine particles include all types of combustion activities (motor vehicles, power plants, wood burning, etc.) and certain industrial processes.  Sources of coarse particles include crushing or grinding operations, and dust from paved or unpaved roads.


PM2.5 is made up of sulfates, nitrates, carbon, and soil.


Albuquerque reports the Air Quality Index for daily pollen and Fine/Coarse Particulates:


 But these numbers are reported as "Index" values, and have to be converted to ug/m3 to compare to measured values:


Over the last week, Albuquerque has reported AQI for PM2.5 of almost 50, which should be about 15 micrograms per square meter, whereas my unit typically reports 30-50 micrograms per square meter, indoors and outdoors.  It is possible that ABQ measures air quality higher from the ground than my unit, or that PM2.5 is lower during the night when I don't check it.

Here is an excellent resource for more information.  Most of the graphics on this page are from this source.

Friday, March 25, 2016

Testing a Relevant SNP?

A new study in Science Magazine by Simonti et al has linked this SNP to a rare condition known as protein-calorie malnutrition (PCM).  The study compared electronic health records (EHR) for 28,000 people with SNPs that are now known to derive from Neandertal DNA.

SNP rs12049593 is in an intron of SLC35F3, which means it does not change the actual structure of the protein, but instead alters the amount of protein produced.  SLC35F3 codes for a protein that helps transport vitamin B1 (thiamine) through the body to the mitochondria, where it can be used to generate and store energy from sugar. The linkage to PCM makes sense, because PCM is characterized by fatigue, malnutrition, and wasting even in the presence of adequate caloric intake.

"Humans depend on diet for their thiamine needs. Very little thiamine is stored in the body and depletion can occur within 14 days. Severe thiamine deficiency may lead to serious complications involving the nervous system, brain, muscles, heart, and stomach and intestines." (Mayoclinic)

"Thiamine is required for the assembly and proper functioning of several enzymes that are important for the breakdown, or metabolism, of sugar molecules into other types of molecules (i.e., in carbohydrate catabolism). Proper functioning of these thiamine–using enzymes is required for numerous critical biochemical reactions in the body, including the synthesis of certain brain chemicals (i.e., neurotransmitters); production of the molecules making up the cells’ genetic material (i.e., nucleic acids); and production of fatty acids, steroids, and certain complex sugar molecules.

Thiamine deficiency can lead to cell damage in the central nervous system through several mechanisms. First, the changes in carbohydrate metabolism, particularly the reduction in a–KGDH activity, can lead to damage to the mitochondria. Because the mitochondria produce by far the most energy required for cellular function, mitochondrial damage can result in cell death through a mechanism called necrosis. Altered carbohydrate metabolism can lead to oxidative stress, characterized by excess levels of highly reactive molecules such as free radicals and/or the presence of insufficient levels of compounds to eliminate those free radicals (i.e., antioxidants, such as glutathione). Oxidative stress can lead to various types of cell damage and even cell death."  (from Role of Thiamine Deficiency in Alcoholic Brain Disease)

Simonti et al state:
"Decreased expression of this transporter in the brain or GI tract could exacerbate malnutrition or its symptoms. It is possible that new dietary pressures may have caused changes in carbohydrate metabolism to be beneficial in early human migrants out of Africa; indeed, there is evidence suggesting that Neandertal-derived genes increase the efficiency of fat digestion. More recently, the reduction of thiamine present in foods from the grain-refining process, as well as an increased intake of simple carbohydrates, make this a potentially harmful allele, because it could reduce thiamine availability although modern diets increase demand."

I am homozygous for the recessive allele of SNP rs12049593.  I have a C where 95% of people have a G or T, courtesy of my Neandertal ancestry.  According to the Simnoti study, I may have some malnutrition symptoms if I do not express the B1 transporter gene.  According to my research, B1 can also passively diffuse if it is ingested at high enough concentrations.

I tested oral administration of 100mg/day of B1, which is more than 6000% of the US RDA but is the only size pill commercially available; apparently, this is a standard doze for supplementing B vitamins.  I weighed myself morning and night for 1 week and did not notice any change in weight.  Subjectively, I noticed some tiredness the first two times I took B1, then I noticed some energy, and after four or five days I do not notice any effect from supplementation.

UPDATE:  Figuring out what allele is variant and which is most common is difficult.  My information above was from 23andme raw data viewer, but when I loaded my data into the excellent Enlis Genome Personal software, I see that I actually have the reference allele, not the rare allele.  So that may explain why I don't respond to supplemental B1.

Wednesday, March 23, 2016

Food4me study tested Nutrigenomics...and found no benefits

Food4me is a large online study designed to test whether personalized nutrition advice based on analysis of phenotypes (waist cicrumference, blood markers: glucose, cholesterol, carotenes, n-3 index ) or genotypes (SNPs in genes such as MTHFR, FTO, TCF7L2, APOE E4, FADS1 ) could perform better than standard nutritional advice.  The study recruited more than 1,600 volunteers from across Europe to take part.  Participants performed quantified health self-analyses such as biometric measurements and movement counts. They also used a do-it-yourself blood sampling technique that involves drying blood from a finger prick on absorbent paper, which can then be analyzed for more than 92 metabolic biomarkers in a lab.  They also submitted saliva samples that were checked for more than 36 genetic variants that have been linked to nutritional needs and health outcomes.

"A scientific knowledge base was developed, capturing the current knowledge in the field of nutrition
with a particular focus on the interaction of food consumption, nutrient intakes, biomarkers,
genetic variation to health. SNP information comprises risk allele frequencies as well as gene
symbols and functions. The collected scientific knowledge represented in the data base covers
currently 35 food items, 92 biomarkers, 36 genetic variations, 16 different health outcomes, and
180 established interactions based on scientific publications and an expert assessment."

After one year, the results are in.  Although their internet-based nutritional intervention was associated with positive outcomes, a recent whitepaper concluded that, after testing various diets, there were no improved health outcomes from phenotypic or genetic information.

The researchers state that, "despite enormous efforts over the last decade to identify gene variants that define the susceptibility of an individual to a life-style dependent disease, the outcomes of the large-scale profiling studies are rather disappointing. Although a large number of genes and variants have
been found (there are for example around 60 genes that carry a susceptibility risk to develop
type 2 diabetes mellitus (T2DM)), the effect sizes of each individual gene variant are generally
very low. In almost all cases, the risk-variant increases disease risks by only a very few percent..."


Wednesday, January 07, 2015

Blood Glucose Charts


From wikipedia article on diabetes.


======
Interesting behavioral health article on hypoglycemia and anger, violence.  
=====
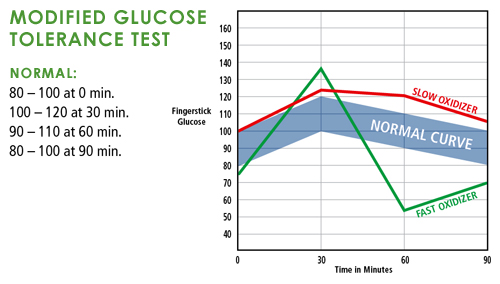
Fast versus slow oxidizers (=induced hypoglycemia).  This website basically recommends eating more fat and protein if you have these below-normal glucose excursions.

Sunday, December 28, 2014

Heart Disease and Blood Lipid Panels

Cholesterol is present in the diet and in the blood, and the difference bears repeating: cholesterol in the diet has very little effect on cholesterol in the blood. While cholesterol blood levels are often talked about as "less is more", we would argue that having values too low can be problematic too. For example, based on WHO data, total cholesterol between 200 and 240 is associated with lowest all-cause mortality, but that is just a simple correlation.

Based on an experimental study on a comparable "Westernized" (?) population, the Japan Lipid Intervention Trial found optimal ranges to be:

Total Cholesterol:180-260 (anything above or below has significant p>0.001 increase risk of all-cause mortality)

LDL: 80-200 (anything above or below has significant p>0.01 increase risk of all-cause mortality)

Triglycerides: N/A - no significant relationship.

HDL: anything above 50 has significant p>0.01 decrease risk of all-cause mortality.

Interestingly, LDL values are usually not measured directly, but only calculated using the Friedewald equation, which has been shown to be inaccurate, especially at low triglyceride values. If you really want to drill down on your blood lipids, your doctor should know that the standard total/LDL/HDL panel is outdated and that newer tests are more accurate.... like the NMR LipoProfile test or a VAP test.

These new tests are important, because not all LDL particles seem to cause heart disease. VLDL particles are smaller than average and are more likely to embed in arterial walls, given predisposing conditions like inflammation (C-reactive protein (CRP) is a good marker of inflammation). If your fasting triglycerides are low you probably have normal healthy LDL, but if they are high you may have much more VLDL. If you also have inflammation....watch out!