Showing posts with label botany. Show all posts

Friday, February 13, 2026

My Attempt to Map a Historic Itinerary

Historic newspapers can be illuminating but also frustrating.  A case in point is the series of articles in the 1864 Arizona Miner detailing "Woolsey's Expedition" in March and April of that year.  

I hoped to deduce some of the actual places visited by the expedition, but the details given were confusing, contradictory, and ultimately insufficient to definitively map where the events took place.  I wonder how many modern newspaper stories, when subject to the same analysis, would fall short?

I analyzed Henry Clifton's account from the May 11, 1864 issue.  The first step was to break the narrative into a numbered itinerary.  I underlined what I thought would be helpful clues, and bolded descriptions I thought would be interesting to compare against present day conditions:


My next step was to try to map the itinerary points on a modern day map.  I added two additionally pieces of information to the text.  First, I looked up that sunrise and sunset were at 6:20am and 6:50pm, respectively. This helps fill in the times for each stop.  Then I filled in the mileage between each stop.  
In the table that follows, question marks indicate uncertainty.  The start and stop points correspond to the itinerary above.


In some cases Clifton gives the mileage, and in some cases the stops can be determined so the mileage can be measured, but in many cases he does not give the mileage.  However, based on the travel and rest times I tried to estimate the mileage.  This can also be constrained by the possible stop locations.  For example, when they stop at a creek or a canyon, there are only so many choices for where that could be.  

This map shows their possible itinerary from Woolsey's ranch to the Apache Rancheria on "Squaw Creek".  Tent icons are campsites and hiking figures are other stops.  

Overview map showing likely itinerary points.

Waypoint #4 makes sense if they followed the drainage downstream from "Cottonwood Spring" SE to the next main drainage that could be described as "east fork of the Aqua Fria".  This fork is now known as Ash Creek.  The "Ash Creek" they named at stop #5 is most likely the next major creek to the SE, which is now known as Little Ash Creek.

My best guesses for stop #4 and stop #5.

Many mysteries remain.  First, they claim to do a lot of hiking at night, but this is extremely rough terrain that would be difficult to navigate by night.  According to the US Naval Observatory historical moon phase calculator, this expedition occurred during the waning last quarter of the moon, so they would not have had much light from the moon.  I don't know what kind of lanterns they had, but they don't describe much difficulty traveling at night, other than a description that they had to "descend carefully" to a creek for stop #7.

At stop #6, which occurred sometime after 10 PM on the night of March 31st, Clifton reports finding species of the garlic family on a ridge.  These small plants seem like they would have been difficult to notice by lantern light.  Interestingly, there are only two species of garlic/onions that grow in this area in the spring now.  One, is Crowpoison, which as the name suggests is toxic.  The other is Largeflower onion, which is not common.  

Second, was the Apache Rancheria at modern Squaw Creek or some other location?  It would make sense that their place name stuck, but Squaw Creek is not exactly a unique name so it is possible that other locations have the same name.  Interestingly these creeks that form the southeast boundary of Perry Mesa have been 
recently renamed Ledni Lii Creek, Gosga Creek, Liya Draw, Che Yagoodiguhn Creek, etc.  I can't find any information about when they were renamed or what the new names mean.

Based on their travel that night from 10 PM until 9 AM and their progress on other legs of the journey, I estimated that they traveled about 10 miles to get there.  However, (for reasons discussed below) I think the site of the Rancheria must have been just upstream of the confluence of Gosga creek and Ilya Draw (AKA North Squaw Creek and Squaw Creek), and this would put them less than 7 miles from camp.  After attacking the Rancheria they managed to get back to camp in less time, so it is possible that they were less than 10 miles from camp.   

Possible site of the Ranchera, upstream of the confluence of Gosga creek and Ilya Draw (AKA North Squaw Creek and Squaw Creek)

In the description of the battle, Clifton states that Company C was west of Company B.  Company B "was in the canon below the rancheria" and chased the Indians up the canyon to where company C was.  Since almost all of the canyons in this part of Arizona run from NE to SW, I had a lot of trouble finding a location where "up canyon" was some westerly.  

Conclusion

Through this exercise of interpreting and attempting to map a historical itinerary, I've come to realize the difficulty of matching newspaper accounts to specific locations.  Without an extremely explicit travelogue, creating a location-based itinerary is either impossible or unreliable.  There were several times when I was ready to give up, but through persevering, rereading the account, and staring at the map I've at least been able to convince myself that some of these locations are approximately correct.  I hope to visit some of these areas in the coming months to retrace the route and add additional information.  

Notes

Note: #PrescottAZHistory blog has an account of Woolsey's expedition that is more of a summary and less of a GIS analysis.  

Note 2: Woolsey organized several expeditions, including a second one in June of 1864 that traversed a much larger area.

Wednesday, January 22, 2025

iNat Isn't Slowing Down in Arizona

The iNaturalist website collects species observations from people all over the world.  It started in 2008 and grew slowly at first and then entered a period of rapid growth in 2017.  As a consequence, the number of species recorded on the website is constantly increasing, passing 300,000 in 2020.  The website is currently adding more than 50 million observations a year. This raises an interesting biodiversity question: how long can the number of species keep increasing?  Another way of stating the question: how many species are there?

Biodiversity scientists use species accumulation curves to estimate the total number of species in a given area.  As they investigate a new study site, they record new species and the date/time the species was observed.  For most sites, the number of new species increases rapidly as scientists describe common species; the number of new species slows as scientists search for more and more rare species.  Graphing the number of species over time should reveal a logarithmic curve.  Based on the equation for that curve, scientists can estimate the asymptote - the number of species the curve will eventually reach given enough time.  This allows scientists to estimate the total number even if they don't finish counting all of the species.


This slowing down does seem to be happening for total species count on iNat.  For example, the 2024 Year in Review showed 50 million observations over the year, and about 1,000 new species (not previously observed and posted to iNat) per month.  

From iNat 2024 Year in Review

In contrast, back in May 2019 more than 6,000 new species were added.  It appears that 2019-2020 was the peak for adding new species, and even as more new users have joined iNat, fewer and fewer new species are being observed.  

These charts show running totals, with new additions colored, so that the logarithmic curve is more visible in Newly Added Species:

From 2024 Year in Review

There were fewer observations and many fewer users in 2019-2020, than now, but the rate of newly added species was much greater.  This appears to indicate that it is getting harder and harder to find new species to add to iNat.  Observable species on iNat are those that can be distinguished with photographic evidence, usually limited to smartphone cameras.  So this estimate does not include microbial life, and probably excludes most microscopic life.  

Its possible that unobserved species are mostly in the middle of remote wilderness areas and that is why fewer and fewer are being observed.  But many of the new species are from the US and Europe - there's still lots to explore!

For example, in Arizona the species accumulation curve is still effectively linear, with about 700 new species each year.  No signs of slowing down here!


The same is true of smaller areas within AZ, for example the Prescott National Forest averages 186 new species observed each year.  

I considered whether the new species could be due to rare birds and insects showing up for the first time.  I also analyzed new plant taxa on Coconino National Forest.  Plants are well-studied and the forest has been extensively surveyed, so it seems unlikely that new species would be discovered yearly.  But, according to the iNat data, not only are new species being continuously discovered, there is no detectable slow down in the rate of discovery!


I'm not sure what conclusions to draw from this analysis.  The standard conclusion would be that we haven't sampled enough species yet to begin to see the rate of new species discoveries slowing down.  This implies that the total number of species is quite a bit greater than the number that have been recorded so far on iNat.  

Another interpretation could be that the actual number of species isn't constant.  In other words, there could be new plants showing up each year on the Coconino.  This could be due to new invasive species, shifting distributions of native species.  It could also be impacted by taxonomist naming conventions; the number of species in even well-explored areas could increase as botanists work to name and describe the huge floristic diversity of the world.

There is still a lot of biodiversity to explore, even in our backyards!

Tuesday, July 30, 2024

How to Use Satellites to Find Growing Plants: A Practical and Theoretical Guide


USGS Maximum consecutive dry days, July 2024


Introduction

Knowing where and when plants are green and growing would help botanists and ecologists plan field work and help managers make real-time land management decisions.  There are many potential sources of geospatial data available but it is difficult to know which sources are most useful.

Over the past year I evaluated the accuracy and interpretability of dozens of indicators that could be used to assess current growing conditions.  These websites, maps, and data layers are mainly provided by US Government agencies to help managers respond to natural resource concerns such as rangeland management and drought impacts.

In my opinion, none of the available resources is a perfect fit to find growing plants.  However, understanding how plant growth is related to biophysical constraints can help identify the best available resources.


Plant Growth Theory

Plant growth (Net Primary Productivity, NPP), is proportional to total soil moisture (SM) and Growing Degree Days (GDD) of accumulated Temperature (T) since the start of that plant's growing season.  Soil moisture depends upon accumulated (total and frequency of ) precipitation (P) minus evapotranspiration (ET).  

 NPP = Sum (SM*T)

 SM = Sum (P-ET)

[In the above equations, "equals" is used to mean proportional, or depends upon. ]

The ideal resource for plant growth would be a direct measurement of NPP.  A second option would be measurement of soil moisture and temperature, with a way of combining them to estimate NPP.  A third option would be measurement of precipitation, which could be used to estimate SM. All of these variables can be measured via satellite, but delays make them difficult to use in real time.  Also, there are important details in how they are measured and modelled that make interpretation difficult.  


Details

Plant Growth: satellites can measure NPP via NDVI (Normalized Difference Vegetation Index), but available sources are delayed (DroughtView), low-resolution (GIMMS), weighted toward trees, and contain artefacts early in the growing season.  Existing models of NPP are not well-calibrated (VegDRI), or delayed and not mapped (RAP).

Soil Moisture: satellites can measure SM, but satellite data (SMAP) is not consistently available, may be inaccurate, and only provides a snapshot, not the sum.  Models of SM are not well-calibrated (NASA LIS).

Temperature: sensor networks can measure T and calculate Growing Degree Days (NPN) but aspect and micro variation are often more important than county-level temperatures.  This is helpful early in the growing season.  

Precipitation: radar and rain gauge networks can measure P and are timely and accurate.  Maps of accumulated P are available from NOAA and number of days with/without rain in the last month from USGS.  However, because P is not a direct measure of NPP, this can only be a general guide to plant growth.  


Conclusions

P - Best. Note that both total and frequency matter.

SM - not available.

T - GDD is helpful in Spring phenology, but don't matter later in the season.

NPP - difficult to use.  Good for viewing thinning and forest fires, not very helpful for spotting wildflower growth or distinguishing between grass and tree green-up.  


NOAA precipitation accumulation as percent of normal for July, 2024

Practical How-To

I recommend using a balance-of-evidence approach that combines the two best sources of precipitation information, NOAA for total accumulation, and USGS for frequency.  If both sources show good precipitation during the recent growing season, there is a good chance that plants are growing well in response to abundant and regular moisture. 

NOAA's National Water Prediction Service provides accumulated precipitation over any time period from 2005-present with less than 24 hour delay.  Their web viewer is currently the only way I know to view this data because I don't have the programming skills to use their API.  

Scroll down to Precipitation Estimate, where it is possible to set the time period of interest and map Precipitation in terms of Observed (totals), Normal (average), Departure from Normal (inches more/less than normal), and Percent of Normal.  The map is sometimes glitchy depending on connection speed.  More details about how precipitation is calculated are available in the help guide.  Note that this map is usually up to date for the previous "water day" ending in the early morning (so for AZ, selecting "Today" shows precipitation that occurred yesterday through 7 am today).

USGS's Drought Monitor provides access to several precipitation metrics, with a 48 hour delay. To assess precipitation frequency/regularity, I use Maximum Consecutive Dry Days (Past 30 days) and Days Since Precipitation.  They also offer total accumulated precipitation over the last 7 and 30 days (again, with a 2 day delay).  Their web-viewer is clunky and hard to use, but it is easily available.  Double click on the Dataset of interest in the left pane and resize the resulting window to view the area of interest.  The layers have no opacity, so to view the underlying map they have to be checked on/off in the Layers pane.  

They also make their data available as WMS that can be added to any ArcGIS desktop or online map.  The opacity can be adjusted on the Group layer that is created after the data is mapped.  However, the time-enabled settings can be difficult to use, and I haven't figured out how to show the data time period.  The web viewer is easier to change the time period and to see the data date range.

Note that USGS Drought Monitor also provides VegDRI and QuickDRI, two models that claim to incorporate all of the biophysical variables listed above (and then some!) to model NDVI difference from average.  These models are extremely complex, but they don't seem well-calibrated to Arizona because I have not found them to be very accurate or helpful.  

Wednesday, May 15, 2024

The Biggest Problem in Conservation: Taxonomy

One of the interesting unspoken secrets of the conservation world is that taxonomists are in charge.  More specifically, what taxonomists consider interesting enough to name as a species or a subspecies determines what can be protected.  After all, it is the Endangered Species Act.  But what if the taxonomists can't agree on what a species is?

This excellent short article in the Atlantic provides examples form hawthorn trees, which, depending on who you talk to, are either in decline and in need of conservation, or so widely distributed and common that it would be like trying to preserve Kentucky Bluegrass.

"A few years ago, conservation groups were gearing up to assign the [balsam-mountain hawthorn] tree the rarest rank a species can receive, which would imply an urgent necessity to conserve it. But [a botanist] decided it was probably a hybrid of two other hawthorns. He still believed the tree should be protected, but instantly, the species went from critically rare to nonexistent, from a conservation point of view."

"A prominent evolutionary biologist, wrote in 1976,  that perhaps no true hawthorn species exist at all—that they make up a sort of genetic continuum that doesn’t allow for coherent species classification."

"[another] botanist... told me the biggest threat to the trees is not land-use changes but botanists themselves, who are unwilling to meet the taxonomic challenge. If no one takes on the task of categorizing hawthorns, then no conservation group can take any measures to save them."

"Now whatever solution [the botanists] come to will determine what we try to save."

Thursday, August 24, 2023

"Trying to define the undefinable": are taxonomists too focused on species?

A recent article in the New Yorker includes a good overview of why identifying species can be problematic:  

"You Name It: Carl Linnaeus and the effort to label all of life" by Kathryn Schulz, August 21, 2023 

Extended quote from article:

"What Linnaeus sought to do was organize nature according to its fundamental, intrinsic divisions--to carve it at the joints, in Plato's famous formulation.  But what he actually did, for the most part, was impose artificial categories on the natural world for the convenience of scientists.

This is not a retroactive assessment; Linnaeus himself knew full well the limitations of his classification method.  To achieve a system completely in accordance with nature was, he wrote, "the first and last wish of botanists."  But the more closely you looked at her bounty the more difficult that prospect became--so, in the meantime, "artificial systems are absolutely necessary."

In philosophy, this tension between intrinsic and imposed categories takes the form of a debate between nominalism and realism.  Realists believe that nature is full of real and discrete categories, from 'amphibian" to "zinc," and that the job of the scientist is to discern them accurately.  Nominalists believe that nature lacks clearly defined categories, and that we simply impose those distinctions upon it--creating, as it were, the illusion of joints where none really exist.  

This is not just the position of post-truth relativists.  "I look at the term 'species' as one arbitrarily given, for the sake of convenience, to a set of individuals closely resembling each other": that is Charles Darwin, in the second  chapter of "On the Origin of Species."  That book, of course, trumpeted to the world a very large problem with the entire notion of a species.  According to evolutionary theory, species are constantly changing--emerging, diverging, going extinct.

The very concept of a species is in radical flux, too, with more than twenty competing definitions in circulation.  Choosing a definition is not just a matter of what goes in the dictionary under "species"; which one you use will determine how you divide up nature, such that a group of creatures that would be regarded as a species by one standard might not merit the label by another.  

All this confusion comes, as Darwin wrote, "from trying to define the undefinable."  Yet committed realists continue to promulgate more and more definitions, in the belief that one of them will map perfectly onto some intrinsic and stable feature of nature.  Darwin called that idea "laughable," a word that captures the impossibility but not the gravity of arbitrarily imposing categories on living beings.

Monday, July 10, 2023

Are Pollinators Necessary for Food Production?

Pollinator enthusiasts claim that "1 in 3 bites of food are dependent on pollinators", but the reality is that many crops have been bred to self-pollinate.  For example, soybeans produce bean-like flowers, and many wild beans do require insect pollinators, but soybean flowers never open; they self-pollinate.  

In the wild, 70-90% of flowering plant species (angiosperms) do require an animal (usually an insect, bird, or mammal) to move pollen from one flower to another. Source. Only a few species have evolved to become self-reliant or to rely on wind.  But in human agriculture, we've selected for species that "breed true", which often means selecting for self-pollination. 

Many flowering agricultural crops would appear to need pollinators, but don't.  Or at most the pollination is optional: it doesn't hurt for insects to visit the flowers, and sometimes they help to fertilize and hence set more fruit, but they aren't strictly needed.  Although about three-quarters of crops benefit in some way from animal pollination, only about 10 % depend fully on pollinators to produce the seeds or fruits we consume, and they collectively account for only 2 % of global agricultural production. Source.

I created this table to show the AZ crops that require pollinators.


Data from Our World in Data: https://ourworldindata.org/pollinator-dependence

More information: https://en.wikipedia.org/wiki/List_of_crop_plants_pollinated_by_bees

Friday, November 11, 2022

Popular plants for Monarch butterflies in Northern Arizona

**Updated 11/16/2022 


As of November, 2022, there were 260 observations on iNaturalist of monarch butterflies in the northern half of Arizona - basically everything north of Phoenix.  I analyzed these observations to try to identify which plants are most important nectar food sources.


iNat link.


I filled in the Life Stage annotation for all larva and pupa.  There are 62 observations of larva (caterpillars), 1 observation of a pupa, and 197 observations of adult butterflies.

The number of monarchs photographed each year has declined from a high of 75 observations in 2015 to an average of 55 a year in 2021 and 2022.  Since the number of iNat users and observations has increased more than 100x since 2014, it seems that the last 2 years represent more effort with less observations, indicating a possible decline in abundance.


For the adults, I annotated the observations using the Observation Field "Nectar / Pollen delivering plant" when I could ID the flower the monarch was observed on.  In some cases, the adult could be observed drinking nectar; in many other cases I assumed that a monarch adult resting on a flower was obtaining nectar.

In total, 71 adult monarchs appear to be drinking nectar from flowers that are identifiable to species or genus.  I documented 27 different plant species being used as nectar resources by monarchs.  This is a large diversity of plant species, considering that this data set included only 71 total observations of monarchs on flowers.

iNat link.

By far the most common plant species was Asclepias subverticillata, the common weedy milkweed species of northern AZ, and also a great plant for monarch caterpillars.  It is possible that some adults were just resting on the milkweed flowers in the process of depositing eggs on the plants, rather than drinking nectar.  Either way, clearly milkweed are important to monarchs.  This species is also popular with a diverse group of other pollinating insects.

Several aster species were also common nectaring plants, as well as butterfly bush (Buddleja), a planted ornamental that apparently lives up to its name!


Monarch presence in Northern Arizona is strongly seasonal, with most adults observed in late summer (August-September), so it is not surprising that some of the late summer Asteraceae such as Ericameria, Helianthus, Bidens and Heliomeris are popular nectar sources.  Since monarchs are generalist pollinators, this data could be consistent with opportunistic (no preference) nectaring.

However, there are many other common plant species flowering during September (such as Gutierrezia sarothrae, Dieteria canescens, Datura wrightii, Purshia stansburyana, Verbascum thapsus, Geranium caespitosum, Achillea millefolium), and no monarchs in this data set were observed nectaring on them. This suggests that monarchs do prefer certain species over others.


Also, there is the question whether the adults observed on flowers during August--October are migrating adults, mating adults, or newly metamorphosed adults.  Given that we do see caterpillars in September, and it takes about 30 days for a monarch egg to grow into an adult, it is likely that all three types of adults are making use of nectar resources in Northern Arizona.  


Caveats and Conclusions

Any mistakes or omissions are my own. I may have misidentified some flower species, but I don't think that would change the overall conclusions.

The small sample size limits the conclusions that can be drawn; more observations are urgently needed to better establish monarch plant preferences.  

Also, this data is subject to the biases of  the "citizen scientists" who use iNaturalist to document biodiversity.  They may be more likely to photograph monarchs on showy flowers, in areas near their homes (landscaped yards and ruderal/disturbed natural environments), and at convenient times of day.

Therefore, this study might be best used to help guide planting decisions to support monarchs in areas near where people live.


Acknowledgements

Thanks to iNaturalist user jdmore who created an excellent wiki explaining how to use the iNat search URLs to filter results, which was a crucial step to analyze this data.

Also, thanks to all of the iNaturalist community, including the 107 people who observed monarchs in the study area, and the 123 people who helped identify them.

Thursday, November 10, 2022

Is measuring biodiversity possible for non-experts?

I’m trying to measure pollinator biodiversity using iNaturalist, but I’m having doubts as to whether this is even possible for a non-expert.

Over the last five years I’ve photographed insects on flowers in my area, with the goal of creating a summary of total pollinator species per plant species per month. I'm using an Observation Field to associate the plant species with the insect Observation:  https://www.inaturalist.org/observations?place_id=1823&user_id=conorflynn&verifiable=any&field:Nectar%20%2F%20Pollen%20delivering%20plant=

I knew from the beginning that this would not be a perfect research study because I’m not systematically sampling the flowers with equal effort and equal time, and I knew I wouldn’t be able to ID every insect, due to the quality of my photographs.

But I hadn’t considered that the level of taxonomic ID could bias the total species counts. Even if I could ID every photograph to Genus, some Genera have dozens of species while others only have a few. Even worse, some taxa have more people helping ID and therefore have more detailed IDs, whereas other taxa have less interest and are stuck at Family level IDs.  

I think this makes comparing pollinator diversity difficult or impossible on iNaturalist. At best I could say something about how many different Genera or Families visit a particular species of plant --  but I’m not sure how important genera- of family-level biodiversity is...

iNaturalist is a great platform for documenting species observations, but now I think the utility of the data is taxa-specific.  For example, I recently went to a talk about rare talussnails and springsnails in AZ, and the speaker advocated using iNaturalist to document observations.  But how could he ID the rare species from iNat photos?  He just does it based on geography.  There’s no way to discover new snail species or new locations on iNat; DNA studies are needed for new populations to ID whether they are a new or existing species. 

I’d also hoped that I might be able to document new specialist pollinator-plant interactions, but I learned in The Bees in Your Backyard (the definitive bee ID book for North America) that even pollen specialists can be nectar generalists, so I don’t know how one would discover specialist interactions from photographs?  Do researchers have to analyze pollen grains on collected bee specimens??

Wednesday, October 05, 2022

Biodiversity Phenology

 There are many ways to explore biodiversity using iNaturalist.  One way to study the biodiversity of a geographic area is with phenology:  the science of when things happen.


For example, it is possible to modify the search URL to find observations of plants within 100 km of Dublin, OH, to search for specific months.  The count of observations for each species give some idea of their abundance in that month.


Central Ohio's most common flowering plants in March.

Central Ohio's most common flowering plants in April.

It is interesting to note that the number of observations for e.g. Bloodroot (Sanguinaria canadensis) increase from March to April, but its relative abundance appears to decrease as Dutchman's Breeches (Dicentra cucullaria), Trout Lilies (Erythronium americanum) and other species are photographed much more in April.

Monday, September 12, 2022

Thistle Misidentification

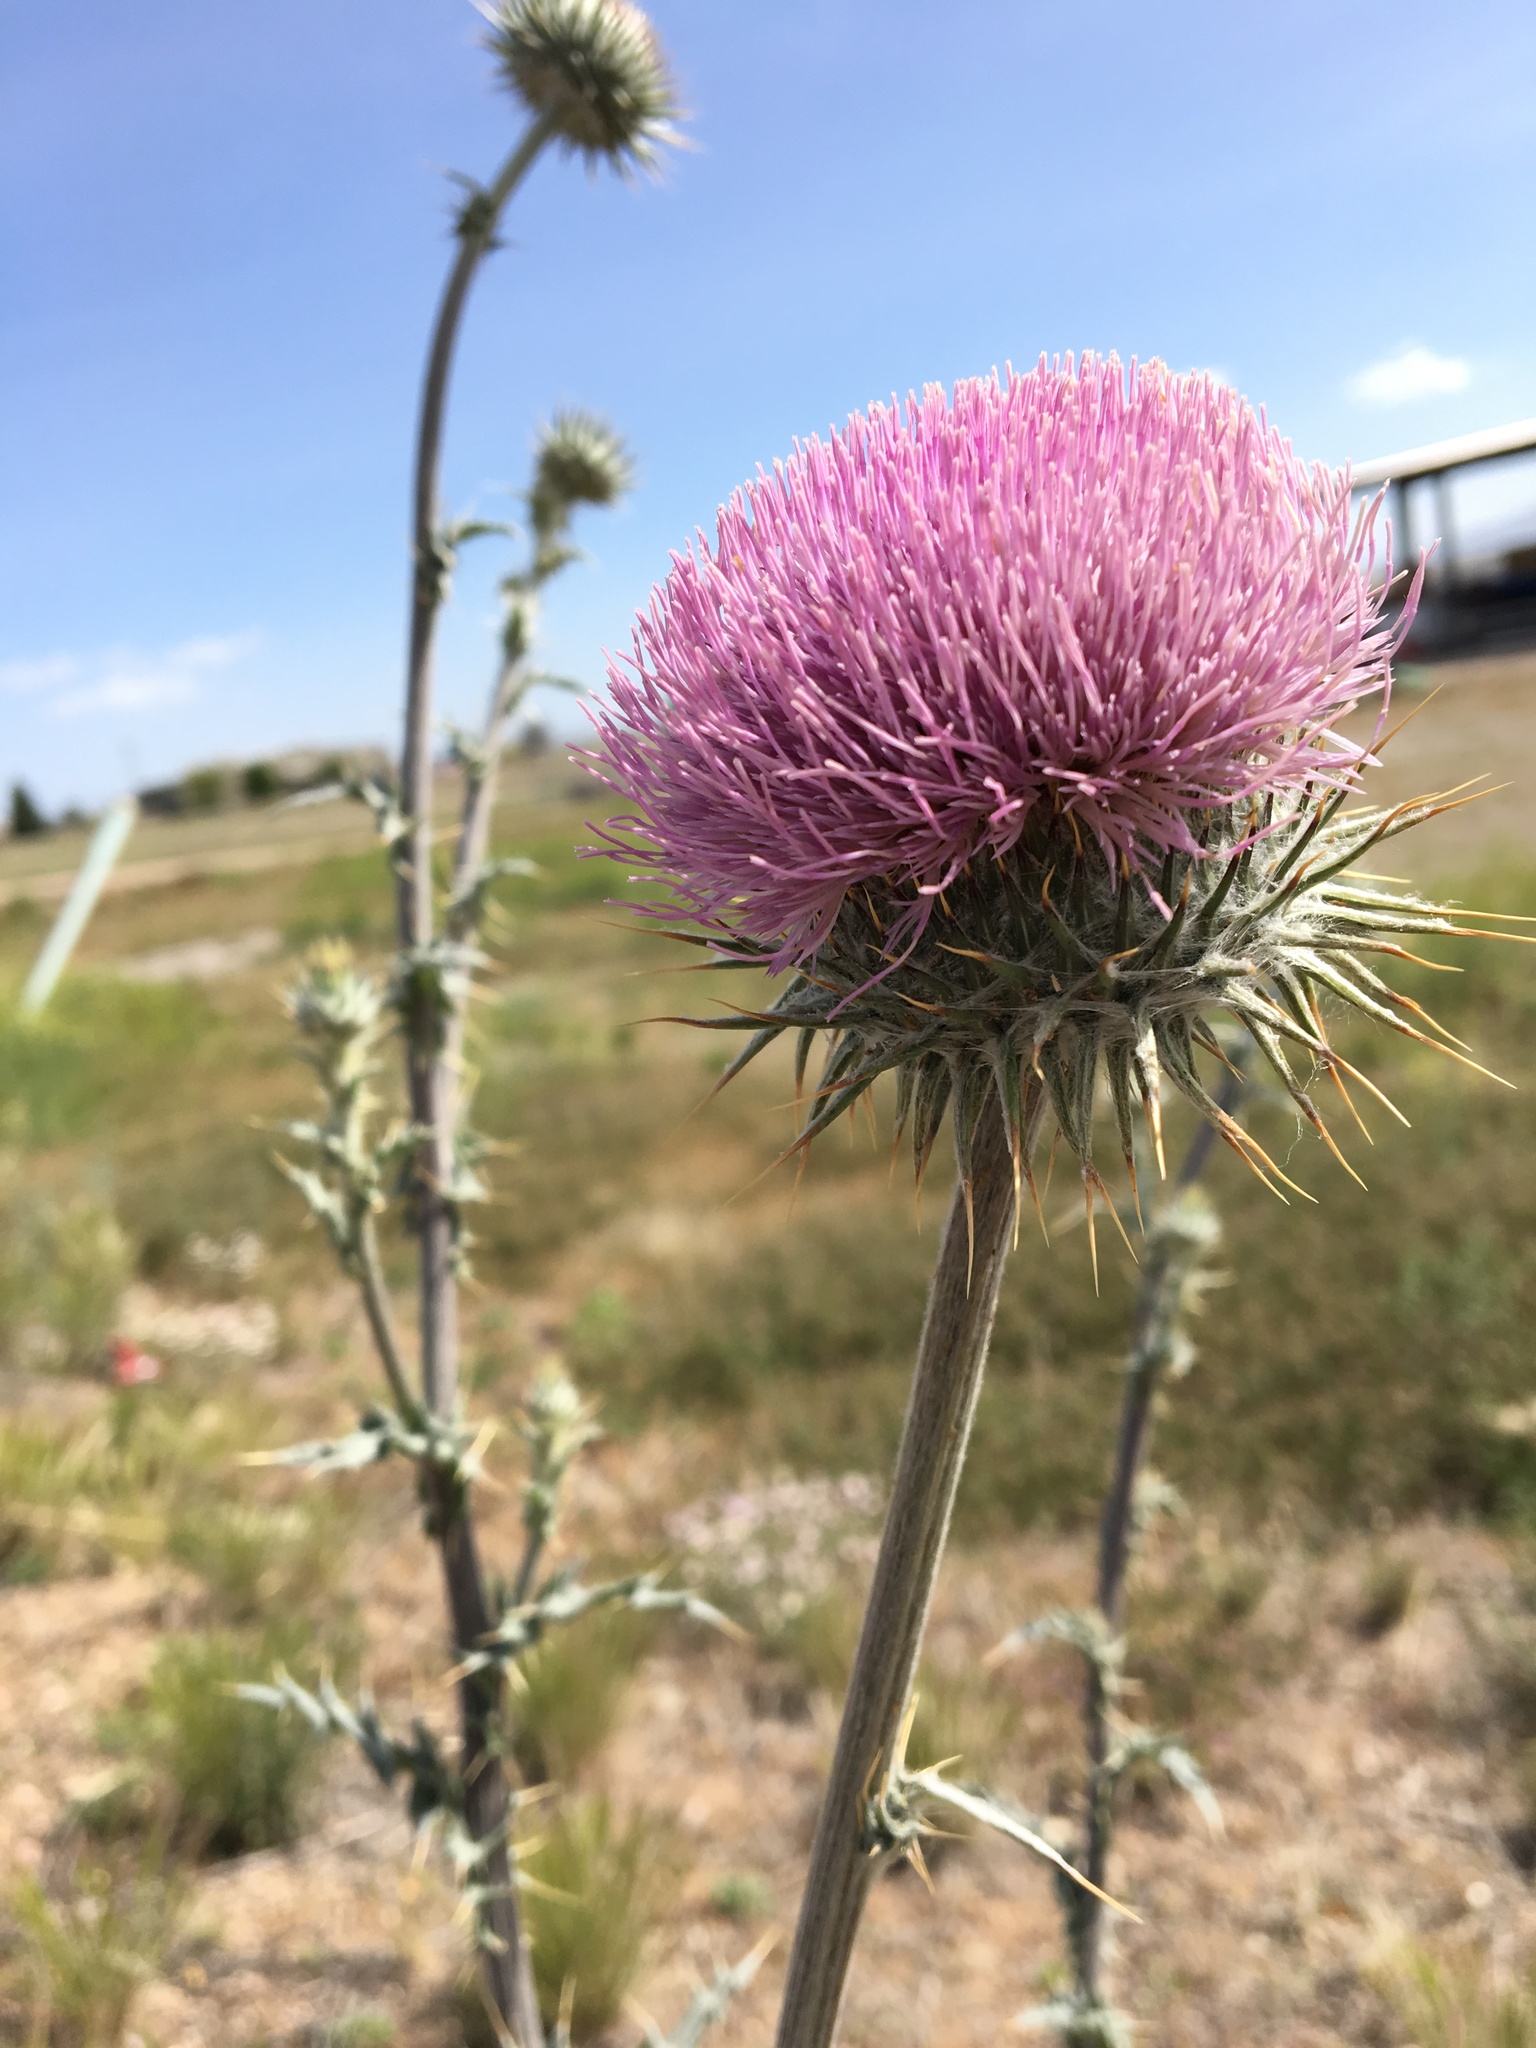
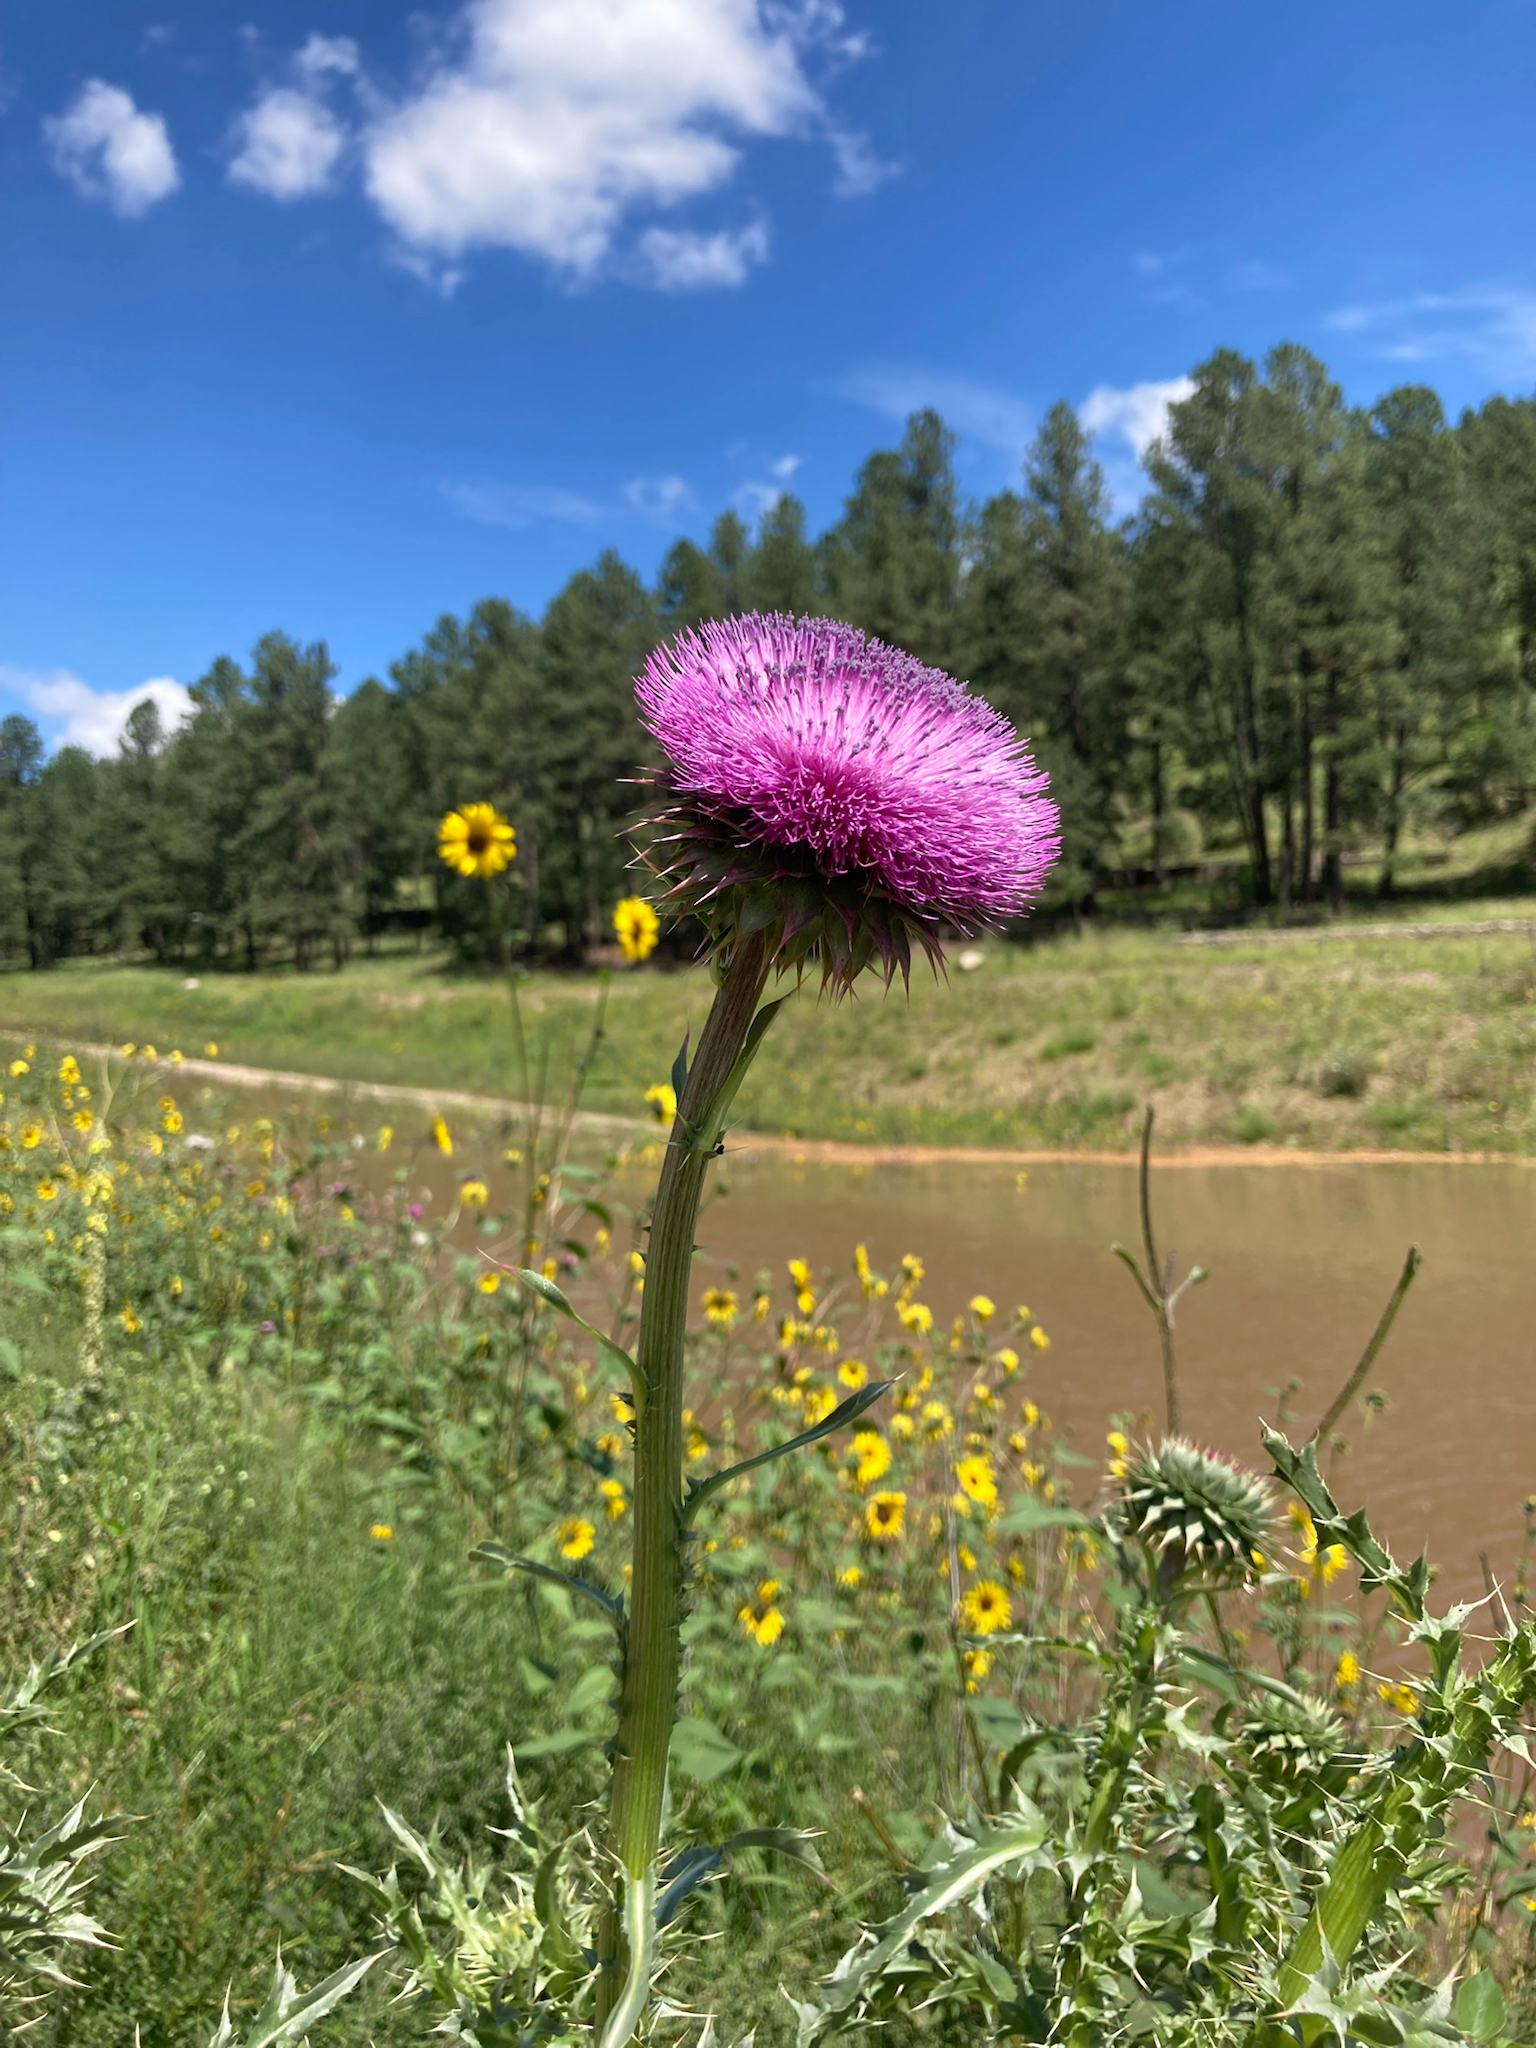
Thistles are amazing flowers, but there are both native and nonnative invasive species in the Western US.  Some people who try to do good by removing nonnative thistles accidentally kill the native species as well. 

NM Thistle, Cirsium neomexicanum. My photo on iNaturalist. Link: https://www.inaturalist.org/observations/15024423

I worked with an AmeriCorps crew in the Sacramento Mountains (Lincoln NF) that had been removing musk thistles.  But I found out they didn’t know how to tell the difference between native and invasive thistles. 

Photo of musk thistle Carduus nutans from iNaturalist user c-guinan. Link: https://www.inaturalist.org/observations/132367683

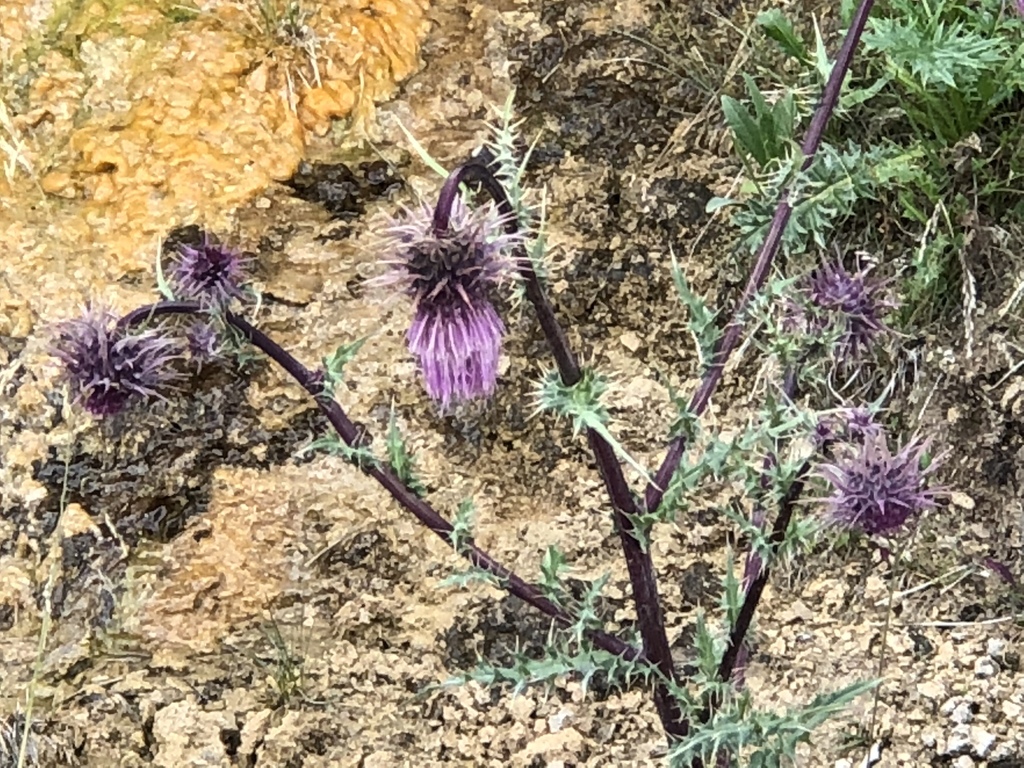
Even worse, they didn’t even know that there is an Endangered species of native thistle in those mountains!  We investigated and it looks like they at least didn’t kill any endangered thistles, but it could have been really bad. 


Photo of Endangered Sacremento Mountains Thistle Cirsium vinaceum from iNaturalist user ck2az.  Link: https://www.inaturalist.org/observations/14433149

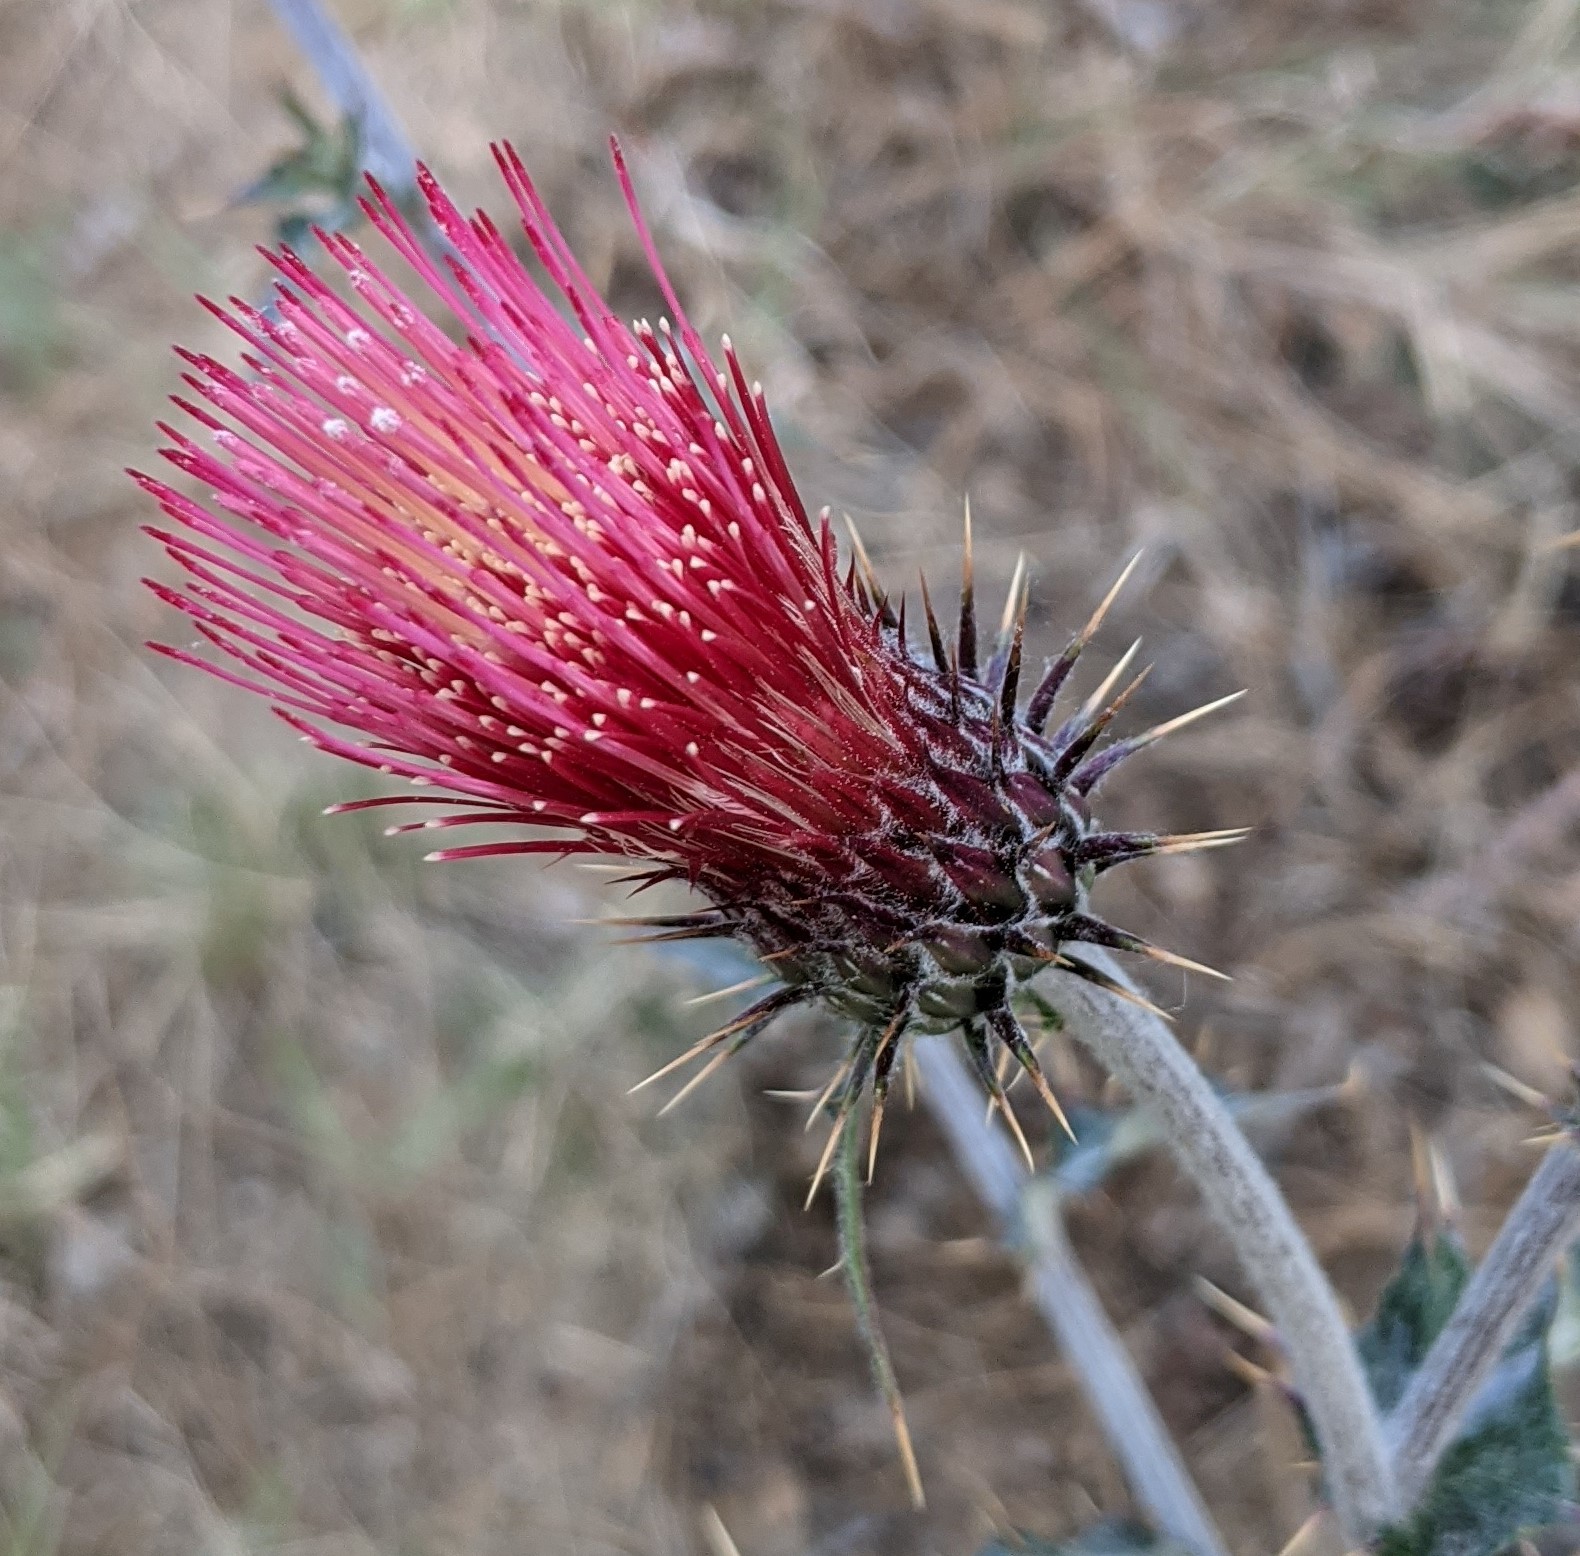
I’m currently trying to find the volunteers on the Prescott national forest who are pulling up all of the Arizona thistle along popular trails.  Its especially troubling to me when people who are trying to do good by removing invasive species end up destroying native species.

Arizona Thistle Cirsium arizonicum.  My photo on iNaturalist.  Link:  https://www.inaturalist.org/observations/87880049

Everyone who’s done natural resource work has stories of project missteps.  I don’t know how to prevent all mishaps, but talking about these misidentifications is a good first step.

The NM Native Plant Society has a great Thistle ID book written by Bob Sivinski.

Tuesday, May 18, 2021

Bear's Ears Research on Legacy Human Plant Communities

The research is quite interesting. They have determined that a large suite of plants used by people in the past are more likely to be found in the vicinity of archaeological sites on Bear’s Ears NM. Basically people were planting medicinal and other useful plants, and those plant communities have persisted at these locations in greater numbers to modern times. We see similar things here in Arizona with agaves, yucca, devil’s claw, and a few other plants. In AZ the phenomenon is sometimes referred to as “Legacies on the Landscape.”

https://www.pnas.org/content/118/21/e2025047118

But looking through the Supplemental table for the paper, they basically included every species that grows up there.  Not surprisingly, native peoples utilized most of the naturally-occurring botanical resources on the landscape.   So their results are really more that cultural sites are associated with biodiversity in general, not specific assemblages of “cultural” species.  

Also, the paper implies that the causality goes native people>plant diversity, but it could just as easily go plant diversity>native peoples, since native people would be more likely to settle in places with more plant diversity (e.g. places with water).

I would be more interested in a paired-down list of the plant species that are truly cultivated and remain associated with prehistoric sites.  For AZ, agave, yucca, devil’s claw, and a few other plants.  Definitely Wolfberry (Lycium pallidum).  They list Wild Potato, Solanum jamesii, which is interesting and does occur in AZ above the rim…..they also list Chenopodium sp, which is a common weed so I’m not convinced that is a good marker of anything.

Chenopodium are usually ubiquitous in pollen and macrobotanical samples taken from archaeological contexts. The typical interpretation is that these plants were used way more than we think. Hard to know whether weedy plants were being intentionally planted or if they started growing more in areas where people were eating, processing, and depositing seeds through their waste. There are a few Chenopodium species that were domesticated prehistorically. In the western US these are amaranths, goosefoot in the eastern US, quinoa in South America, etc.

Wednesday, March 04, 2015

Seed Zones for Western Wheatgrass

The USDA Pacific Northwest Field Station has published research examining the population geographic structure of Western Wheatgrass.  They measured three major phenotypic factors from grass seed collected throughout the interior northwest: height, flowering date, and leaf width.

Wednesday, February 11, 2015

Sunflowers in NM


Common sunflowers in NM:
Perennials:
Helianthus ciliaris Blue-green, short, forming extensive colonies from perennial roots.  Leaves sessile.

Annual (no rhizomes):
Helianthus annuus  -Phyllaries ovate, abruptly narrowed to acuminate tip, ciliate
Helianthus paradoxus  phyllaries lanceolate, gradually tapering to the tip, not ciliate.  Usually no branches, no white “eye” in flower center. In wetlands.
Helianthus neglectus  phyllaries lanceolate, gradually tapering to the tip, not ciliate.  Usually branched, with a white “eye” in flower center.  Lower leaves w/ cordate bases.  Larger heads than H. petiolaris. 
Helianthus petiolaris  phyllaries lanceolate, gradually tapering to the tip, not ciliate.  Usually branched, with a white “eye” in flower center. Lower leaves w/o cordate bases.

Key based on Allred's Flora Neomexicana

Thistles in NM

I've compiled a list of common Cirsium species in the lowlands (not mountains) of Southern New Mexico, and mapped their collectioned vouchers from across NM.

Map created using swbiodiversity.org 

Cirsium ochrocentrum – common.  Flower heads are bigger, and petals are longer than C. neomexicanum, often more brilliantly-colored, but plant is smaller.  Flowers usually taller than wide. 

Cirsium neomexicanum  -- Flower head looks more “bushy” because spines are more strongly spreading than on C. ochrocentrum, allowing flower to open more (wider than tall)

Cirsium texanum  - like C. ochrocentrum, but flower heads less than 25mm long, smaller overall.

-Based on Allred's Flora Neomexicana

Wednesday, October 15, 2014

Suburban Development Transect: Biodiverse Desert to Trash-filled Parking Lot

2000

2003

2008

2011
A transect walking a few miles from the indisturbed desert through new housing developments into the city looks like time played in fast-motion.  The ecologist's glasses allow us to see the moving picture of life rather than limiting our vision to the usual single frame.  By substituting space-for-time, we can put on time-travel goggles.  What do we see?

Normally we visit a site for a day, maybe once a year for intensive longitudinal studies, maybe never again.  With this transect we could see the changes in species composition from unique, biodiverse desert with its gnarled shrubs to fresh asphalt streets, planted landscaping and lawns, and a monoculture of weeds in the bladed 'empty patches' between houses and in right-of-ways.  The stream channels were all filled in and replaced with impoundments or concrete-lined ditches.

Eventually we ended up in the back lot behind a storage unit complex.  The slight depression there caught water and supported some of the tallest native flowering trees we'd seen.  The lot was also used, apparently, as a dumping ground and was filled with all kinds of trash.

Later that night, back in my home neighborhood, I saw dual-images of what the land looked like before and after development.  I saw the rocky ground thick with idiosyncratic cacti and weird four O'clock flowers.  And I saw wide asphalt streets, joggers, tall pine trees, oleander, and grass lawns.  It is so difficult to see the past, I felt that my dual-vision was a kind of X-ray superpower, a new found ability to see through reality to what might have been.  Reality has a way of erasing the possibility that things could have turned out differently.

A nice walk in the wilderness can sometimes substitute space for space, so that you can see your neighborhood space as the absence of native wildlife instead of the presence of cars, roads, and lawns.  I suppose some people see nature as empty, and even I see it this way sometimes too: some areas are devoid of active communal life.  For example, on this particular transect we saw no rabbits, no ground squirrels, and no other mammals in the wild.  I don't think we saw a lizard until we got to the rock walls of suburbia.  But I was amazed at the botanical emptiness of our developed landscapes: out of the more than 70 native species of wildflowers and Chihuahan desert shrubs, I saw less than 5 after we crossed the first freshly paved asphalt road.

Of course, there are a diverse mix of landscaping plants, many of them native somewhere, if not in the Chihuahan desert.  Interestingly, the mexican palo verde seems to have escaped cultivation and is now growing up into the wild watercourses that snake off the mountains.  Few other weeds seem able to invade intact ecosystems, although Russian thistle is omnipresent wherever the ground has been cleared.

I think, though, that if the transect had continued further into the past/future, through abandoned neighborhoods or restored areas, the native wildflowers and shrubs would reappear.  Especially with the rains this monsoon, they seem quite happy where they are, and old pipelines have a nice covering of desert marigold, creosote, and javalena bush.  I don't really feel that the desert is destroyed by development...maybe in the long-term view it just goes away for awhile, or changes shape for a spell.  Until the wave of bulldozers breaks and subsides, the desert remains as potential...

Thursday, April 17, 2014

Water-year to Date Departure from Normal


The area East of Carlsbad, NM in Eddy county going into Lea county has had 2-4 or even 6 inches more rain than normal since October 1st.  The figure above shows that this is almost triple the normal precipitation in places. The mesquite is bright green and there are many flowers, despite below-freezing temperatures at the beginning of the week.  A good place for some springtime botany!

Tuesday, February 04, 2014

Passion-flower Distribution in the Sonoran Ecoregion

Source: SEINet


Passiflora (Passion flower vine) is a tropical genera of vines, which reach their northernmost distribution with P. mexicana in the Santa Teresa mountains, North of the Gila River.  They produce edible passion fruits, but the herbiage is extremely unpalatable to animals, to the point that (reportedly) starving horses will not eat P. foetidius due to the stinky sticky hairs.

I have never seen these monsoon-bloomers in the wild in Arizona, but hope springs eternal in the Sky Islands...there are three species in Arizona:  P. arizonica, P. bryonoides, and P. mexicana:


P. arizonica ca 4-5.5 cm in diameter, whitish, the corona white or purplish.


P. bryonioides ca. 2.5-4.5 cm in diameter, whitish with purplish bands on corona. 


P. mexicana ca. 2-3 cm in diameter, light green or yellowish green, the corona red or reddish purple.

There are two more species in the Sonoran Desert south of the border:

P. palmeri (no description available)


P. suberosa (no description available)

Tuesday, December 10, 2013

A Range Overlap of the Pinyon Pines in central AZ

In which mountain range could one find three different U.S. Pinon Pine species (P. cembroides, P. edulis, and P. monophylla)?

Trick question!

Surprisingly, not a major mountain range, but the low hills surround Aravaipa Canyon.  This area may be an important biogeographical linkage between the sky island mountain ranges to the south, dominated by Mexican Pinyon (Pinus cembroides) and the larger mountains to the north, dominated by Pinus edulis.  Pinus monophylla is more of a Colorado plateau and California mountain species, but with weird disjunct populations as far South and East as the Florida mountains near Deming, NM!  

Specimen collection data from SEINet.

Tuesday, November 19, 2013

Best Public Lands GIS

There are no perfect web viewers for ecological and public land GIS.

ProtectedPlanet is an open-source platform that has the most comprehensive map of special protected areas for the whole world.  In the US, highlights include BLM Areas of Critical Environmental Concern (ACEC), USFS Research Natural Areas, Special Botanical Areas, etc.

Peakbagger.com has the best index of free online topo maps, and their database is searchable for mountain ranges and peaks (Google often can't find geographic features).

SEINet is fast becoming the most comprehensive botanical specimen map database in the world, with new collections constantly expanding their coverage.

Wundermap has many useful features, including a better display of, for example, USGS's Stream Gauge Network, as well as weather and sea surface temperature.

I'm still trying to decide if the Forest Service's ForWarn system, or their Disturbance Mapper, is a better way to view forest fire, insect infestation, and phenology data.  Both are slow and clunky as of this writing.

Wednesday, October 23, 2013

Four of my Favorite Characteristic New Mexico Shrubs

Chilopsis linearis, Desert Willow.  In landscaping, this large-flowered shrub will flower for almost half the year.  It is a dependable riparian tree that can survive in washes that are too hot and dry for cottonwood.

Forestiera pubescens.  New Mexico Privet.  Native shrub in the Olive family can form thickets at the base of canyon walls and along upper benches above rivers.  Birds prize the berries almost as much as the non-native Russian Olive.

Lycium pallidum.  Pale Wolfberry.  Lyciums are widespread in the Southwestern deserts, and Lycium pallidum is the most widespread.  Goji berries are Lycium barbarum (nonnative), and Lycium pallidum has been cultivated for its fruit for 1,000s of years.  The trumpet-shaped flowers attract Sphyngid Hawkmoths and Hummingbirds.  

Robinia neomexicana.  New Mexico Robinia, Fabaceae.  Despite its rapacious thorns, this plant made my list for its tenacity and abundance across a range of habitats.  From riparian area in the South to Ponderosa hillsides in the North, Robinia provides abundant pink blossoms and herbaceous cover.