Showing posts with label health. Show all posts

Friday, August 15, 2025

An Alzheimer's Bet Based on Biology

Alzheimer's research has been accused of being hijacked by a misleading hypothesis that only survives to enrich drug companies.  The amyloid hypothesis has been extensively critiqued, including by this essay on the blog Astral Codex Ten that looked at problems with the original paper that started (by some accounts) 30 years of misguided research.  

In response to a call for counter-arguments, David Schneider-Joseph, presented a compelling argument in favor of the amyloid hypothesis.  He even went so far as to propose a bet; that a drug targeting amyloid would achieve at least a 75% slowdown in Alzheimer's in the next 12 years.

I wouldn’t take David’s proposed bet, because I’m sure some company will find a way to gerrymander clinical endpoints to get to 75% “slowdown”.  Probably with a drug that has horrible side effects and costs north of $100,000/year.  

I would bet on the following:  the leading* therapy in 12 years will not be one whose sole intended mechanism involves amyloid production or clearance, e.g. monoclonal antibodies, small molecules, or gene editing that work directly on amyloid.  

    * “Leading” means some combination of efficacious and most widely used.

This is the important sense in which the amyloid hypothesis is wrong: it may be “correct” in some narrow biochemical sense, but it is a dead end.

In a way this is an easy bet on the status quo continuing indefinitely, because the current drugs used to treat Alzheimer's do not target amyloid.  However, I’m also bullish on emerging therapies such as creatine, lithium, calcium channels, and mitochondrial therapies including far infrared, ketones, and other ways to generally affect metabolism and autophagy/mitophagy.  Some of these might be shown to improve clearance of amyloid, but the amyloid hypothesis is not necessary or very helpful in the development of these “general" therapies.  

My prediction is based on a general model of how biology works.  Simple infectious and traumatic medical conditions seem most amenable to targeted therapies, while general conditions like mental illness, cancer, and Alzheimer’s are so complicated and depend on so many general health processes that targeted therapies tend to miss the mark.  

Ideally, we would pursue both lines of treatment, but our pharma system is biased toward patentable targeted treatments to the exclusion of all else.  The “Amyloid Mafia” is shorthand for this trend in Alzheimer’s research.  

However, even given the funding disparity between amyloid research and other treatments, non-amyloid treatments are arguably already more efficacious.  As a good Bayesian, I predict this will continue, and so this seems like a safe bet to me!


Wednesday, August 07, 2024

How Accurate Are Digital Thermometers?

I wanted to know my temperature, so I would know when I have a fever.  I was also curious how my temperature compares to "normal" people.  

But first, I had to figure out how accurate my digital thermometer is.

Accuracy is how close a measurement is to the true value; precision is how much variability there is in repeated measurements.  The thermometer says it is accurate to within +/- 0.2 F, but I have no way to test that because I have no other measurement of my temperature to compare it with.  I can test the precision by taking multiple readings in a row.  This usually yields the same number, indicating that the precision is very good (i.e. low variability).  However, sometimes, depending on how I hold the thermometer, the readings can vary by as much as 0.4.

What is my normal temperature?  

To test this, I took my temperature over 10 days in April, 2024.  I took 48 readings, a total of 3-4 for each hour of the day.  For each reading I lay down for a minute and then put the thermometer in my mouth, as far back under the tongue as possible.  Each reading took 90-120 seconds, so this effort included more than an hour of total time spent taking my temperature.


My average temperature is 97.4, almost a full degree less than the widely-quoted population average of 98.2.  Standard deviation is 0.6 degrees, so 68% of the time my temperature is between 96.8 and 98.  This variability include any precision variability in the thermometer.

My temperature usually reaches a minimum in the morning, rises to a maximum is in late afternoon / early evening, and then begins to fall before bedtime.  My highest temperatures were recorded after exercise, doing chores, eating a warm/fatty dinner, and lying in the sun.  Minimum temperatures were recorded lying in bed, after exercise, and after breakfast.  

Friday, March 15, 2024

Lactic Acid in Health and Disease

 Introduction

Lactic acid is produced for energy when mitochondria can't use oxygen for aerobic respiration. 

Lactic acidosis develops when you have too much lactic acid in your body. Athletes monitor their blood lactate levels as a way to pace their training.  Chronic resting lactate levels greater than 2 mmol/L represent hyperlactatemia, whereas lactic acidosis is generally defined as a serum lactate concentration above 4 mmol/L.   High levels of lactic acid can cause muscle soreness, fibromyalgia-like symptoms, and anxiety.

Overproduction or Under-removal?

The body naturally produces and consumes lactate: although anaerobic exercise can raise blood lactate levels over 10 mmol/L, resting lactate in health adults is usually between 1 and 2 mmol/liter and is constantly produced and consumed.  High levels of lactic acid can be caused by overproduction or under-removal of lactate.


Resting lactate is usually between 0.5-1.5 in a large (10,000 participant) study of healthy adults.  More info.

Although many organs consume lactate, the liver and the kidney represent the major sites of lactate uptake and clearance as they metabolize approximately 53% and 30% of daily lactate production, respectively. Lactate is metabolized by two main mechanisms: First, lactate can be used as a substrate to regenerate glucose by gluconeogenesis, a process that is exclusive to liver and the kidney. Second, at least 50% of circulating lactate is removed and metabolized by means of oxidation during resting conditions. Unlike gluconeogenesis, which is restricted to liver and kidney, oxidation can take place in many organs, including the heart, brain, and skeletal muscle.

Supplements that affect Lactic Acid

Biotin (B7) is a cofactor required for gluconeogensis.  Aspirin can increase lactate levels by interfering with LDH lactate dehydrogenase, the enzyme responsible for turning lactate into pyruvate for gluconeogensis.   B1 deficiency impairs Citric Acid cycle and leads to accumulation of pyruvate and lactate.  Organic acids involved in the Citric Acid cycle may may provide substrates to better metabolize lactate and may reduce the acidifying side effects of elevated lactate (i.e. reduce Potential Renal Acid Load (NRAL)).  Nutrient deficiencies of CoQ10 and lipoic acid have also been associated with elevated lactic acid levels in both urine and blood.   Magnesium in muscles helps to decrease contractions and lactate buildup.  

Exercise

Slow exercise (i.e. HR below 100) can lower blood lactate and blood glucose levels in healthy adults.

Mitochondrial Dysfunction in Disease

Many diseases, included Type-2 diabetes, Chronic Fatigue Syndrome, and Long Covid, are associated with mitochondrial dysfunction and increased resting lactate levels.  Post-exertional malaise (PEM) is a major symptom of ME/CFS and Long Covid and may be caused by elevated lactate levels.  Although we don’t know the cure, #StopRestPace is the best treatment because only resting and then reducing/pacing activity can lower lactate levels.  

Lactic acid is being investigated as a possible metric of Long Covid and PEM severity.  If it plays a causal role in these diseases, methods that reduce lactic acid buildup may be promising treatments.  

Research

Elevated blood lactate in resting conditions correlate with post-exertional malaise severity in patients with Myalgic encephalomyelitis/Chronic fatigue syndrome. https://www.nature.com/articles/s41598-019-55473-4

-Patients having ≥1 lactate measurement ≥2 mmol/L defined elevated lactate group. The study included 123 patients. Elevated (n = 55; 44.7%) and normal (n = 68; 55.3%) lactate groups were comparable except for PEM, which was more severe in the elevated lactate group.


Decreased Fatty Acid Oxidation and Altered Lactate Production during Exercise in Patients with Post-acute COVID-19 Syndroms.  https://www.atsjournals.org/doi/full/10.1164/rccm.202108-1903LE

-The transition from fat oxidation to glucose oxidation occurs prematurely, suggesting metabolic reprogramming and dysfunctional mitochondria.

Figure 1 from paper.  Long Covid patients show greater increases in lactic acid at low intensity exercise compared to controls.  Blue and purple are Long Covid patients (with and without comorbidities (like diabetes), respectively) and grey and black are matched controls (with and without comorbidities, respectively).

Tuesday, February 06, 2024

A Health Supplement Dosed Incorrectly

A supplement with promising anti-aging results* is dosed too low by all supplement companies.  This review article by Life Extension (LE), contains lots of good information and citations about a fisetin.  

Source: https://www.lifeextension.com/magazine/2021/2/fisetin-senolytic-benefits

Fisetin is a promising senolytic that is found in low concentrations in strawberries.  It would be necessary to eat several pounds of strawberries to achieve an effective dose.  Life Exention (LE) is a reputable supplement company dedicated to anti-aging support.  However, even LE failed to select the right dose for their supplement.

The study cited in the review above showed effects in mice at 60 to 100mg/kg body weight per day (Yousefzadeh et al, 2018).  For humans, this would be more than 4 to 6 grams of Fisetin. Using a standard mouse to human conversion factor for effective dose, that would still be more than 325-550mg of Fisetin.  

Assuming the LE supplement is 25x as bioavailable (as claimed), it would still need to be dosed at 13-22mg (1 pill is only 8mg, so 2-3 pills/day). BUT: Yousefzadeh et al already dosed Fisetin in phospholipids (liposomes), so it is not clear that the LE supplement really is more bioavailable or if it would be the same. If it isn’t more available, a consumer would need to take 40 to 70 pills per day to match the dose in the mouse study. 

Although there are unknowns in translating animal doses to humans and determining bioavailability, in this case LE has human pharmacokinetics from the Akay study (Krishnakumar et al, 2022). That study used 192mg of Fisetin per dose, and measured peak plasma concentrations (Fig.5) around 250ng/mL. The LE supplement dose of 8mg is less than 5% of the tested dose, and is probably equivalent to the unformulated (ie insoluble) Fisetin in that study. 

So, in conclusion, LE developed a more bioavailable Fisetin. But they then dosed it to be as equally ineffective as non-bioavailable Fisetin.


References

Yousefzadeh MJ, Zhu Y, McGowan SJ, et al. Fisetin is a senotherapeutic that extends health and lifespan. EBioMedicine. 2018 Oct;36:18-28.

Krishnakumar IM, Jaja-Chimedza A, Joseph A, Balakrishnan A, Maliakel B, Swick A. Enhanced bioavailability and pharmacokinetics of a novel hybrid-hydrogel formulation of fisetin orally administered in healthy individuals: a randomised double-blinded comparative crossover study. J Nutr Sci. 2022 Sep 9;11:e74. doi: 10.1017/jns.2022.72. PMID: 36304817; PMCID: PMC9574875.   https://www.ncbi.nlm.nih.gov/pmc/articles/PMC9574875/


*However, recent results from mouse study did not find any benefit:  Harrison, D.E., Strong, R., Reifsnyder, P. et al. Astaxanthin and meclizine extend lifespan in UM-HET3 male mice; fisetin, SG1002 (hydrogen sulfide donor), dimethyl fumarate, mycophenolic acid, and 4-phenylbutyrate do not significantly affect lifespan in either sex at the doses and schedules used. GeroScience (2023).  https://link.springer.com/article/10.1007/s11357-023-01011-0

Wednesday, September 08, 2021

Fitbit Data Analysis: HRV and Temperature

 Comparison

Between April/May 2020 and August/September 2021....

    .... my resting HR went from average 52.4 to 55.3

    .... my deep sleep went from average 75.6 to 91.5 minutes


Nightly HRV analysis

Night of Sep 4-5th:  Morning HRV was 62 in Elite HRV, 82 in ithlete, 41 in Fitbit, and 64 in HRV logger.  


Night of Sep 5-6th: Elite HRV was 66, ithlete was 82, Fitbit was 51, HRV logger was 54.  94% of time HR was below resting.  


Sep 6th-7th (but only 6th is shown, due to not downloading Sep 7th data yet...)

Comparison of cheststrap (30 sec sample data smoothed to 5 minute window, Fitbit HRV sampled on 5 minute intervals).  Fit looks pretty good.


Recently found out Fitbit records temperature as well.  There is a diurnal rhythm, with interesting variations.  Sep 4th and 7th were both early morning outdoor exercise (jogging and hiking, respectively).  


More temperature details:

The Inspire 2 temperature sensor is at least directionally-accurate!

The nightly data ("Computed Temperature" file) has what looks like temperature in Celsius. For me, it is 31-32 Celsius at night, which is around 90 F. This is the data that is reported as Skin Temperature in Health Metrics.

Interestingly, there is also continuous 24 hour temperature data at 1 minute intervals ("Device Temperature" file). This data appears to be recorded as variation (+/-) from some baseline, as the numbers are always between +3 and -8 for me. Again, probably Celsius. I plotted my data from the last few days, and the times when I was exercising outside in the sun were consistently +2 degrees above other times that I would guess were cooler.

I don't know if the temperature measures are absolutely correct, but they do at least make sense and could potentially be used to identify unexpected temperature anomalies.

If anyone else is trying to download their data, note that you have to request it on the Fitbit account setting website, and then confirm the email.


Tuesday, July 06, 2021

HIIT Science

 All information is from https://hiitscience.com

HIIT Science will be a classic in exercise physiology.  It breaks down high intensity interval training into 6 different types of training, depending on energy system (aerobic, anaerobic, neuromuscular) to be trained:


"Envisage receiving a stressful hit on your neuromuscular/ musculoskeletal system – day in day out – session after session. As per Figure 1, these would all be HIIT Types #2, 4, 5, & 6. I’m sure you can imagine how this would likely result in a train wreck for most individuals. More often than not, we need substantial periods of recovery (often days) between such sessions to allow the neuromuscular/ musculoskeletal system to adapt appropriately (think how long it takes for muscle soreness to go away)."  https://hiitscience.com/why-the-hiit-types/

Each type is built around specific intensities and interval times:


"Traditionally, HIIT is performed by running or cycling....When such equipment is unavailable, HIIT can even be performed skipping using a jump rope or by completing stationary movements (e.g., squats, frontal or lateral lunges, push-ups, jumps) during the interval period (Table 1). These latter HIIT variations require more familiarisation and are likely more demanding on the neuromuscular system (6), but they can also be effective through their ability to target both cardiovascular and neuromuscular systems simultaneously (5)."  https://hiitscience.com/high-intensity-interval-training-the-key-strategy-to-maintain-fitness-during-periods-of-reduced-activity/

They argue that passive recovery is more beneficial than active, since it allows for more work during each interval.  https://hiitscience.com/recovery-bout-intensity-of-hiit-active-or-passive/


Bottom line:

- Shorter rests increase HR and leads to more cardio conditioning

- Longer sets increase burn and lead to more anaerobic conditioning

- Higher intensity/weights increase neuromuscular stress and lead to more muscle growth

- Focus on all three increases stress and leads to exhaustion, longer time between workouts, and loss of fitness


Tuesday, June 16, 2020

Sleep Apnea: Research and Self-Experimentation Results

 Abstract

I tested several sensors that claim to measure sleep apnea through optical measurement of blood oxygen content.

Background

Blood oxygen arterial saturation (Sa02) is approximated by Sp02.  At 5,000 feet elevation, Sp02 should be above 92%. Values under 90% are considered low.  Hypoxemia is dangerously low blood oxygen, defined as Sp02 <88% for more than 5 minutes.   (Hypoxia is low tissue oxygen levels)

An oxygen saturation level over 95 percent is considered normal. Anything below 92 percent oxygen may be a sign of breathing problems during sleep, such as sleep apnea or another disorder like severe snoring, COPD or asthma.  (Low levels can also be caused by anemia.)

Sleep apnea is characterized by a cessation of airflow lasting 10 seconds or more. Hypopnea (shallow breathing resulting in desaturation) is a decrease in airflow lasting 10 seconds or more with a 30% oxygen reduction and a 3 to 4% desaturation from the baseline. It is not uncommonpatients with sleep apnea to desaturate below 88%. 

Note: low Sp02 is an indicator of sleep apnea and is not necessarily the mechanism of the bad effects.  It may be possible to not have hypoxemia, but still have interrupted sleep.  

Sleep apnea and hypopnea can cause small awakenings that disrupt normal sleep cycles.  This can cause irregular heart beats, high blood pressure, blood sugar excursions, strokes, heart attacks, etc.  Most common effect is to create chronic, elevated stress response.  

Results

- Fitbit Charge 2 never showed any apnea episodes

- Biostrap showed several, including some that my wife didn't remember

- Wellue 02 ring showed several mild episodes per night.  Based on other testing, this sensor seemed potentially the most accurate, but location on finger wasn't comfortable.  Also ended up not being accurate because I sometimes sleep on my arm, cutting off circulation, which reduces Sp02.

Conclusion

I have been diagnosed with mild sleep apnea and my wife has no known apnea.  We both tried the Sp02 wearable sensors and they consistently showed the same level of apneas between us, either none (Fitbit) or mild (Wellue 02 Ring).  Based on the lack of a clear and actionable signal from these sensors, I no longer use them to track apnea events.  Instead I focus on trying to minimize possible breathing issues and promote general good sleep hygiene to try to improve restfulness. 


Saturday, May 23, 2020

HRV "Resonant Frequency" Test

HRV is often used to assess relaxation and recovery, but it is not clear if it correlates with R&R, or somehow causes it.  I think the claim is that it causes it, because HRV is supposed to directly reflect autonomic activity, with higher values indicative of more balanced sympathetic and parasympathetic activity.  (But some recovery scores are calibrated to not let the score get too high all at once.)

But HRV is very susceptible to intentional breathing frequency.  This can be good or bad, depending on whether this manipulation is considered functional or just gaming the system.  

HR naturally slows on the exhale, and speeds up on the inhale, reflecting the dominance of parasympathetic and sympathetic systems, respectively.  By adjusting the frequency of breathing to be resonant with some natural rhythm, HRV can be increased optimally.

I tried breathing rates from 4.5 to 6.5 breaths/minute (at 0.5/bpm steps) and found 5 breaths/minute (=6 seconds in, 6 seconds out) to be optimal for increasing my HRV.  This is my personal optimized meditation breathing frequency for reducing stress.  

HRV is greatest when I take belly and chest breath deep in, then really relax completely on breath out.


Monday, February 24, 2020

Exercise Types and Crossfit

Types of Exercise
Long and slow - metabolic conditioning. Generally should be below 60% HRM. Similar to recovery workouts, but those are usually short and slow, less than 30 minutes, on the day after a hard weight or interval training.  Metabolic conditioning is at least 30 minutes, but can be quite long, depending on conditioning.  Builds aerobic (heart) and metabolic (mitochondrial density).  Do not combine with weights in same workout.  Good to use different muscles from those trained in weights. Stronger By Science article.

Weights, skill work (short and intense with long rests).  Need to rest enough between sets to bring heart rate down and to recover muscle energy. Let HR return to near-resting before each set. Weights are usually periodized so not trying to hit PRs every time. Important to stop far before exhaustion.  Missing weights for several weeks does not result in a decrease in strength (PainScience article). 

Interval training (HIIT, short intense with short rests) training at ~80% HRM. Includes sprinting. Can work close to exhaustion. May be added to weight lifting at end of workout as a "drop set". 

A Note on Crossfit
Distinguishing the public-facing sport of Crossfit from the reality in a Box can be difficult.  Crossfit from the outside, despite introducing functional fitness, looks like a very regressive and simplistic training style characterized by unimodal "short and hard" training, whereas anyone who studies exercise science knows that athletes train at different intensities, not just 100% all the time. And from the inside its clear that's what Crossfit does, with Box coaches setting up interval circuits in their gyms, etc. But all of the official workouts from the Crossfit.com homepage to the Open, to the Sanctionals to the Games look like unimodal exercise.

Thursday, December 26, 2019

Ethnography and Human Health Pioneers

I'm interested in people who have traveled the world, learning from the diversity of human adaptations and health responses.

Esther Gokhale

Weston A. Price

Jaws: The Story of a Hidden Epidemic

Monday, June 20, 2016

Atherosclerosis

An external file that holds a picture, illustration, etc.
Object name is ijms-16-09749-g001.jpg

Pathogenesis of atherosclerosis. (a) In the first stage, low density lipoprotein-cholesterol (LDL) is deposited in the endothelium and undergoes oxidative modification, resulting in oxidized LDL (oxLDL). OxLDL stimulates endothelial cells to express adhesion molecules (vascular cell adhesion molecule-1 (VCAM-1), P-Selectin) and various chemokines (e.g., Monocyte Chemoattractant Protein-1 (MCP-1), Interleukin 8 (IL-8)). This leads to a recruitment of monocytes, which transmigrate into the intima and differentiate to pro-atherogenic macrophages; (b) Macrophages harvest residual oxLDL via their scavenger receptors and add to the endothelial activation and, subsequently, leukocyte recruitment with the secretion of Tumor Necrosis Factor α (TNF-α) and IL-6; (c) The increasing plaque volume promotes neovascularization. Proliferating smooth muscle cells (SMCs) stabilize the nascent fibrous plaque. With deposition of fibrin and activated platelets on the dysfunctional endothelium that expresses tissue factor (TF) and von Willebrand factor (vWF), a pro-thrombotic milieu is formed; (d) Foam cells can undergo apoptosis and release cell-debris and lipids, which will result in the formation of a necrotic core. In addition, proteases secreted from foam cells can destabilize the plaque. This can lead to plaque rupture, in which case extracellular matrix molecules (e.g., collagens, elastin, TF, vWF) catalyze thrombotic events.
(PMC full text: Int J Mol Sci. 2015 May; 16(5): 9749–9769. Published online 2015 )
File:Endo dysfunction Athero.PNG

Sunday, April 10, 2016

The Problem with Nutrigenomics

"Personalized nutritional counseling is a burgeoning field. Several companies, including Vitagene, Nutrigenomix and DNAFit, are already offering individualized dietary counseling.  Their efforts are based mostly on genetic testing, but scientists have only just begun to explore the links between DNA and good nutrition. “I think companies offering personalized dietary advice are probably running ahead of the evidence,” said John Mathers, director of the Human Nutrition Research Center at Newcastle University in Britain." [NYTimes Blog]

Introduction

Science skeptics have recently reviewed these services, and found plenty of quackery. [Science Based Medicine] [Skeptical Raptor]

However, there is some research to back up the idea that genetic testing can provide insights into metabolic disorders.  There may be as many as 200 SNPs for which there are proven metabolic effects, and only a subset of these alter nutrient requirements in a significant portion of the population [e.g., the rs1801133 MTHFR SNP and folate requirement in 15–30% of the population (Solis et al., 2008) and the rs12325817 PEMT SNP and choline requirement in 20–45% of the population (da Costa et al., 2006)].

What do genetic testing services measure?

The human genome consists of about 3 billion nuceleotide bases, each of which is either A,C, T, or G.  A reference genome based on the similarities of all genotyped humans has been assembled, along with a corresponding reference database of all of the point "mutations" where individuals differ from that baseline.  So far, scientists have documented about 150 million of these single nucleotide polymorphisms, called SNPs.  The average person doesn't have all of these differences, however; most people have about 3 millions SNPs that differentiate them from the reference human genome.   Since 3 million is about 0.1% of the 3 billion base pairs, most humans differ from each other by about 0.1% of our DNA. Ancestry genomic testing services like 23andme test for a few hundred thousand SNPs for $100-$200.  For $1000-10,000 a complete genomic sequence can be obtained.  (there are about 3 billion bases total.  

Examples: MTHFR – metabolic pathways and nutrigenomics

In humans, SNPs in the gene MTHFD1 increase the demand for betaine as a methyl-donor, thereby increasing the dietary requirement for choline. Another SNP in the gene PEMT prevents the activation of this gene by estrogen, thereby decreasing endogenous production of phosphatidylcholine (a source of choline) in the liver and increasing the dietary requirement for choline. [Choline: Critical Role During Fetal Development and Dietary Requirements in Adults. Ziesel]

But note that it is not so simple.  There are several forms of the MTHFD1 gene, for example MTHFD1L and MTHFD2. If MTHFD1 is commonly mutated, it may be a pseudogene.

Complexities interpreting SNPs

No simple test can unravel the intricacies of the human genome, and consumers should be suspicious of anyone claiming to be able to interpret measurements of tens of thousands of genes, with millions of genetic variations, some of which have effects on hundreds or thousands of the small molecules of metabolism (and perhaps on thousands of peptides or proteins involved in metabolism).
[A grand challenge for nutrigenomics.  Steven Zeisel. 2010.]

Mistakes in genomics data

Note that 23andme data, like any large genome scan, can have mistakes in it.  For example, the Enlis genomics blog found more than 500 likely mistakes in a sample of 23andme raw data!  (Enlis)

Furthermore, many important nutritional SNPs are not testing by 23andme.

Solution: Metabolic Testing
There is a genetic test for MTHFR variations. But there’s also a cheaper and more accurate way to test for whetherMTHFR variations are causing disease. We simply check the levels of homocysteine in the blood...In other words, the homocysteine levels determine our actions, not the MTHFR test results.[Cleveland Clinic]

Friday, March 25, 2016

Testing a Relevant SNP?

A new study in Science Magazine by Simonti et al has linked this SNP to a rare condition known as protein-calorie malnutrition (PCM).  The study compared electronic health records (EHR) for 28,000 people with SNPs that are now known to derive from Neandertal DNA.

SNP rs12049593 is in an intron of SLC35F3, which means it does not change the actual structure of the protein, but instead alters the amount of protein produced.  SLC35F3 codes for a protein that helps transport vitamin B1 (thiamine) through the body to the mitochondria, where it can be used to generate and store energy from sugar. The linkage to PCM makes sense, because PCM is characterized by fatigue, malnutrition, and wasting even in the presence of adequate caloric intake.

"Humans depend on diet for their thiamine needs. Very little thiamine is stored in the body and depletion can occur within 14 days. Severe thiamine deficiency may lead to serious complications involving the nervous system, brain, muscles, heart, and stomach and intestines." (Mayoclinic)

"Thiamine is required for the assembly and proper functioning of several enzymes that are important for the breakdown, or metabolism, of sugar molecules into other types of molecules (i.e., in carbohydrate catabolism). Proper functioning of these thiamine–using enzymes is required for numerous critical biochemical reactions in the body, including the synthesis of certain brain chemicals (i.e., neurotransmitters); production of the molecules making up the cells’ genetic material (i.e., nucleic acids); and production of fatty acids, steroids, and certain complex sugar molecules.

Thiamine deficiency can lead to cell damage in the central nervous system through several mechanisms. First, the changes in carbohydrate metabolism, particularly the reduction in a–KGDH activity, can lead to damage to the mitochondria. Because the mitochondria produce by far the most energy required for cellular function, mitochondrial damage can result in cell death through a mechanism called necrosis. Altered carbohydrate metabolism can lead to oxidative stress, characterized by excess levels of highly reactive molecules such as free radicals and/or the presence of insufficient levels of compounds to eliminate those free radicals (i.e., antioxidants, such as glutathione). Oxidative stress can lead to various types of cell damage and even cell death."  (from Role of Thiamine Deficiency in Alcoholic Brain Disease)

Simonti et al state:
"Decreased expression of this transporter in the brain or GI tract could exacerbate malnutrition or its symptoms. It is possible that new dietary pressures may have caused changes in carbohydrate metabolism to be beneficial in early human migrants out of Africa; indeed, there is evidence suggesting that Neandertal-derived genes increase the efficiency of fat digestion. More recently, the reduction of thiamine present in foods from the grain-refining process, as well as an increased intake of simple carbohydrates, make this a potentially harmful allele, because it could reduce thiamine availability although modern diets increase demand."

I am homozygous for the recessive allele of SNP rs12049593.  I have a C where 95% of people have a G or T, courtesy of my Neandertal ancestry.  According to the Simnoti study, I may have some malnutrition symptoms if I do not express the B1 transporter gene.  According to my research, B1 can also passively diffuse if it is ingested at high enough concentrations.

I tested oral administration of 100mg/day of B1, which is more than 6000% of the US RDA but is the only size pill commercially available; apparently, this is a standard doze for supplementing B vitamins.  I weighed myself morning and night for 1 week and did not notice any change in weight.  Subjectively, I noticed some tiredness the first two times I took B1, then I noticed some energy, and after four or five days I do not notice any effect from supplementation.

UPDATE:  Figuring out what allele is variant and which is most common is difficult.  My information above was from 23andme raw data viewer, but when I loaded my data into the excellent Enlis Genome Personal software, I see that I actually have the reference allele, not the rare allele.  So that may explain why I don't respond to supplemental B1.

Wednesday, March 23, 2016

Food4me study tested Nutrigenomics...and found no benefits

Food4me is a large online study designed to test whether personalized nutrition advice based on analysis of phenotypes (waist cicrumference, blood markers: glucose, cholesterol, carotenes, n-3 index ) or genotypes (SNPs in genes such as MTHFR, FTO, TCF7L2, APOE E4, FADS1 ) could perform better than standard nutritional advice.  The study recruited more than 1,600 volunteers from across Europe to take part.  Participants performed quantified health self-analyses such as biometric measurements and movement counts. They also used a do-it-yourself blood sampling technique that involves drying blood from a finger prick on absorbent paper, which can then be analyzed for more than 92 metabolic biomarkers in a lab.  They also submitted saliva samples that were checked for more than 36 genetic variants that have been linked to nutritional needs and health outcomes.

"A scientific knowledge base was developed, capturing the current knowledge in the field of nutrition
with a particular focus on the interaction of food consumption, nutrient intakes, biomarkers,
genetic variation to health. SNP information comprises risk allele frequencies as well as gene
symbols and functions. The collected scientific knowledge represented in the data base covers
currently 35 food items, 92 biomarkers, 36 genetic variations, 16 different health outcomes, and
180 established interactions based on scientific publications and an expert assessment."

After one year, the results are in.  Although their internet-based nutritional intervention was associated with positive outcomes, a recent whitepaper concluded that, after testing various diets, there were no improved health outcomes from phenotypic or genetic information.

The researchers state that, "despite enormous efforts over the last decade to identify gene variants that define the susceptibility of an individual to a life-style dependent disease, the outcomes of the large-scale profiling studies are rather disappointing. Although a large number of genes and variants have
been found (there are for example around 60 genes that carry a susceptibility risk to develop
type 2 diabetes mellitus (T2DM)), the effect sizes of each individual gene variant are generally
very low. In almost all cases, the risk-variant increases disease risks by only a very few percent..."


Complex Science: The Role of Vitamin D Receptor (VDR) Genotype Polymorphisms (SNPs)

Vitamin D regulates the expression of hundreds of genes, with widespread hormonal and immune effects.  But whether vitamin D is good for you may depend on your genes.  According to one hypothesis, supplemental vitamin D causes allergies and asthma.  [1]

But the biochemistry is complex.  The main circulating metabolite is 25-hydroxyvitamin D or 25(OH)D, a biomarker of vitamin D status.  The active vitamin D metabolite 1,25(OH)2D3 binds to nuclear vitamin D receptor (VDR), which exists from under 500 to over 25,000 copies per cell in many human tissues including thymus, bone marrow, B and T cells and lung alveolar cells.  Gene expression can be varied over a 100-fold range by subtle modifications of introns and promoter regions outside of the gene[1]

The SNPs that seem to affect VDR are not in the exon; they may affect RNA production in the promoter region. It is unlikely that increased or decreased vitamin D sensitivity is simply mediated by a genetic variation in the VDR. Vitamin D requires several enzymatic steps to be activated, transported and degraded; receptor signalling requires several co-factors and all of these may contribute additive or multiplicative effects on vitamin D sensitivity.

Possibly because of this complexity, progress in this field has been slow.  I reviewed several papers, most of which found very small or no effects from common SNPs.  For example, although most papers found insufficient or deficient levels of vitamin D throughout the population, a case-control study only found a small effect on circulating 25(OH)D from one of the SNPs tested. [2].  A randomized controlled trial found effects from more SNPs, but each contributed very small effect sizes. All SNPs tested had, at most, +/-5% effect on circulating 25(OH)D. : "Three SNPs had statistically significant interactions: rs10766197 near CYP2R1, rs6013897 near CYP24A1, and rs7968585 near VDR, with per allele effect sizes ranging from −4% to +3% differences in [25(OH)]."[3]

These complex and unimpressive results are representative of the difficulties inherent in assaying SNPs for clinically-relevant phenotypes.  Most SNPs slightly modify expression or binding of a protein, such that it takes the combination of dozens or hundreds of different SNPs to create any significant phenotype.  Biochemistry is complex, and it is always possible that other gene or protein interactions can ameliorate or exacerbate any small perturbation from any given SNP.

Citations:
[1] Variants in the vitamin D receptor gene and asthma.  2005.  

[2] Vitamin D levels and vitamin D receptor gene polymorphisms in asthmatic children: a case–control study.


Monday, February 01, 2016

Osmotic Regulation of GI Tract

At its most basic level, diarrhoea results from an imbalance of absorption and secretion of ions and solute across the gut epithelium, followed by the movement of water in an attempt to restore the appropriate ion concentrations. Often, this imbalance is caused by the presence of bacteria that secrete toxins that disturb the organization of the epithelium.  NIH

The gut, known as the enteric nervous system, is located in sheaths of tissue lining the esophagus, stomach, small intestine and colon, and plays a key role in human emotions. But few know the enteric nervous system exists, and therefore gut health is often overlooked. Symptoms from the two brains can get confused....

The intestine absorbs nutrients while simultaneously forming a barrier to noxious substances and bacteria. Along its 7 metre length, the human intestine displays regional specialization, which is further marked by the presence of distinct cell types in different areas.

Osmotic laxatives, such as Fleet Phospho-Soda, Milk of Magnesia, or Miralax, and nonabsorbable sugars (such as lactulose or sorbitol), hold fluids in the intestine.  More info.

Friday, January 15, 2016

Why I Plan to Get the Seasonal Flu Vaccine Next Year

Introducing The Virus

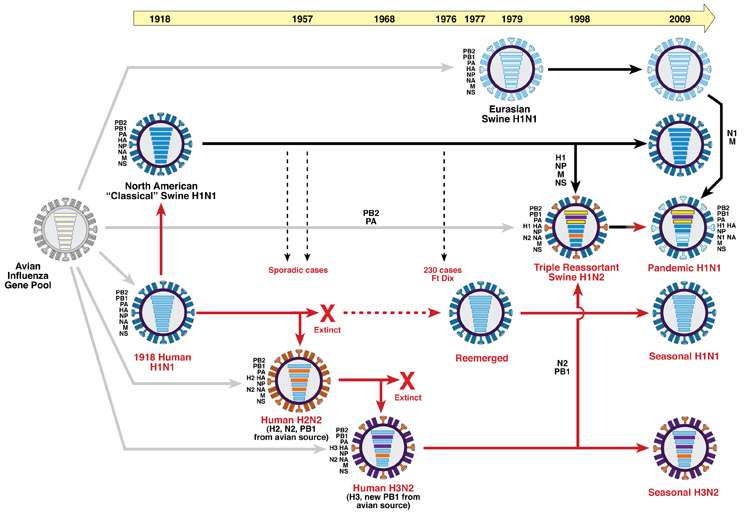
Image of flu virus with antigen proteins on phospholipid(?) surface and RNA in the middle. From. http://www.cdc.gov/flu/professionals/laboratory/antigenic.htm. Tamiflu works by binding the purple neurominadse proteins. Tamiflu was developed from shikimic acid, which was originally available only as an extract of Chinese star anise but by 2006 30% of the supply was manufactured recombinantly in E. coli.[54][55]

Vaccine viruses are chosen (i.e., February for the Northern Hemisphere flu vaccine) because it takes 6-8 months to grow them in chicken eggs. Health officials would like to grow them in human(?) cell culture, but that it not currently allowed. Eggs are problematic because viruses may adapt to the egg.

"As a result, Immunologically naïve ferrets) are the most sensitive method available for detecting antigenic differences between influenza viruses."(from http://www.cdc.gov/flu/professionals/laboratory/antigenic.htm)

Evolution and Types of Virus

H3N2 (swine) flu and H1N1 (avian) flu are main lineages. Major outbreaks occur suddenly and unpredictably through transmission of new varieties from animal hosts. Seasonal (common) flus are derived from the same lineage, but generally evolve slowly and predictably. Each year, novel viruses make the leap from animal to human. For example, during the 2013–14 influenza season, one case of human infection with an new strain of H3N2v virus occurred in a child from Iowa with known direct exposure to swine. Birds seem to have co-evolved with the flu virus and do not mount an immune response to it. Therefore (luckily!) it appears to evolve much more slowly in resevoir species than in humans. This has important implications for the dynamics of seasonal and epidemic flu outbreaks.


Influenza A is the most common. It is highly likely that of all the seasonal influenza strains circulating at the present, one of them will multiply and give rise to the entire seasonal influenza populations in around 5 years. The descendants of all other viruses will most likely be extinct.


For example, the 2014–15 influenza vaccines used in the United States have the same antigenic composition as those used in 2013–14. The trivalent vaccines should contain an A/California/7/2009-like (2009 H1N1) virus, an A/Texas/50/2012-like (H3N2) virus, and a B/Massachusetts/2/2012-like (B/Yamagata lineage) virus. (http://www.medscape.com/viewarticle/826572_6)

The lineage of evolutionarily successful viruses is usually termed the trunk of H3N2 influenza’s evolutionary treea:


The tree is based on hemagluttin protein sequence evolution, colored according to estimated geographic location, indicating high permanence of the trunk in China and Southeast Asia. The genetic changes occur on the neuroamidase and hemoagglutin virus surface proteins, causing antigenic drift. The truck of the H3N3 tree with a single dominant lineage contrasts with more branching trees of other flu types where different varieties often co-circulate, such as H1N1, and Influenza B and C. This graph and these findings are complicated by whole-genome sequencing: a new graph shows overall viral genome evolution in The evolution of epidemic influenza by Martha I. Nelson and Edward C. Holmes Nature Reviews.
Figure courtesy of Lemey P, Rambaut A, Bedford T, Faria N, Bielejec F, et al. http://theglobalscientist.com/2014/11/03/what-can-data-science-tell-us-about-influenza/


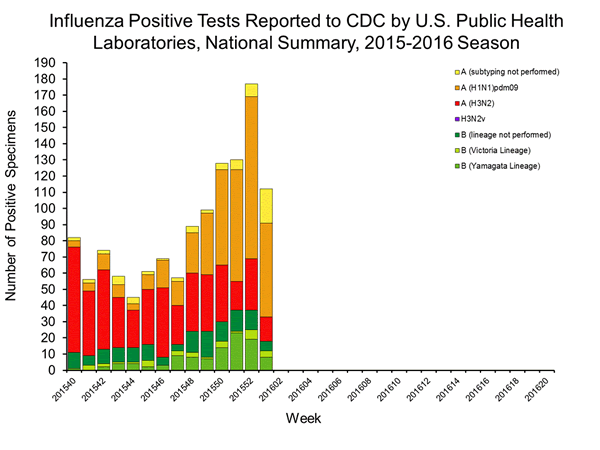
Current Trends - CDC FluNet


http://www.cdc.gov/flu/weekly/


Is flu increasing...

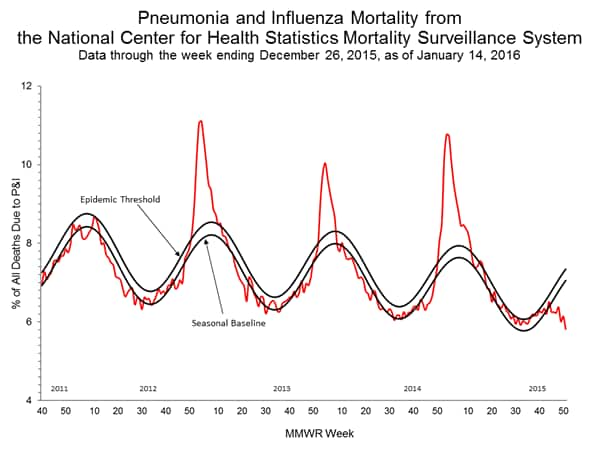
This chart is from the same page....http://www.cdc.gov/flu/weekly/. The periodicity of flu seasons and epidemics is still being studied. Peaks occur during the winter in northern latitudes at ~2–5 year intervals, usually during H3N2-dominant seasons, since the 1968 pandemic. Recent phylogenetic analysis of viruses from single populations has shown that the virus does not ‘over-summer’, but dies out at the end of each seasonal epidemic, and that subsequent seasonal viral re-emergence is ignited by imported genetic variation.

Or decreasing?

Weekly Map

http://www.cdc.gov/flu/weekly/usmap.htm

Monday, January 04, 2016

Ideal Amount of Potassium and Sodium Consumption to Minimize Mortality.

In the spirit of the type of analyses presented in the Perfect Health Diet, I wanted to post some correlations that appear to imply causation.  These two graphs plot Potassium and Sodium Excretion (which is assumed to be a good proxy for intake, assuming people in the study were at steady-state) versus the Odds Ratio of mortality. The odds ratio is a normalized measure of the probability of death.


The first graph illustrates that in this sample, the more potassium consumed (and hence excreted), the lower the odds ratio of mortality.


The second graph illustrates that mortality is higher for those consuming both more than, and less than, 4 g of Sodium per day.  Interestingly, the increase in mortality risk increases more slowly above 4 g/day than it does below 4 g/ day, suggesting that consuming slightly more than 4 g/ day is healthier than consuming slightly less than 4 g/day.

I think these types of analyses could be used to set standards for a whole range of vitamins, minerals, and perhaps other "Goldilocks" substances.  Goldilocks substances are things which are healthy in moderation, but either too much or too little can be harmful or hazardous.  Obviously, some substances such as toxins and radiation are inherently harmful, even down to the smallest dose (but see hormesis theory).

Source.  Urinary Sodium and Potassium Excretion, Mortality, and Cardiovascular Events N Engl J Med 2014; 371:1267 September 25, 2014.  This study looked at over 100,000 people from dozens of countries.

Monday, May 11, 2015

Cultivating a Healthy Skin Microbiome

A company is marketing a probiotic spray designed to help cultivate a healthy skin microbiome.  The spray contains Ammonium Oxidizing Bacteria (AOB; specifically the genus Nitrosomonas) that derive their energy solely from consuming the ammonia and urea found in sweat.  Supposedly, if you have enough AOB, you don't smell bad because they consume all your sweat, releasing beneficial nitric oxide gas!


I wanted to learn more about the skin microbiome, and found this comprehensive article with diagrams to show skin follicles, etc the complex topography and ecology of the skin environment.

These new data are based on DNA assays, and with improvements to these techniques, viruses, mites, and fungi are also being inventoried. This is certainly an improvement from the old days when only culturable bacteria were studied.  Here is a classic paper about the microbial correlates of dandruff.  Apparently there is no cause of dandruff, but simply a feedback between bacteria and fungi and the scalp. A fungus called Malassezia spp can release compounds that stimulate epidermis to proliferate.    Fungicides cure dandruff by killing the Malassezia spp, but many people harbor Malassezia spp without dandruff.   Perhaps an "ecological" cure could involve cultivating probiotic bacteria?


The same article also has the classic diagram showing different microbial communities on different body parts, based on their temperature, moisture and oilyness (sebum versus apocrine ).


Interestingly, soap and shampoo may be destabalizing our skin microbiome, in the same way that antibiotics can impact the gut microbiome.  For example, many ingredients in personal care products have been found in laboratory tests to inhibit "good-guy" AOBs, including sodium lauryl sulfate (SLS is one of the harshest detergents), sodium coco-sulfate, and even castile-type soaps. (Source)

To maximize ammonia utilization, AOBsproduce unique enzymes on elaborately folded cell membranes. These membranes are intricately folded so that they can increase the surface area for ammonia-oxidation. This means that they are able to boost both their ammonia-oxidizing capacity and their energy output.  However, this elaborate membrane architecture also renders AOBs particularly sensitive to membrane-disrupting chemicals, such as anionic surfactants found in modern soaps and detergents.

Detergents replaced simple soap in our hygiene routine soon after WWII and form a major part of most bath products. Anionic detergents such as lauryl sulphates, sarcosines and sulfosuccinates can be harsh to the skin and especially the microbiome.

When reading the ingredients list on your cleaning products, you can identify anionic surfactants as those that have the following in their names:

Sodium
Ammonium
Magnesium
Sulfate
Sulfonate
Gluconate

(For example, sodium laurel sarcosinate, magnesium laurel sulfate, and sodium gluconate.)

Nonionic surfactants are gentler to the skin microbiome, although not entirely harmless. (Source) They include:

Ethoxylates
Alkoxylates
Cocamide

All of my soaps and shampoos contain these ingredients, except for Black African soap "made from shea butter and palm kernel oil mixed with ashes".  The detergent in this soap is laurel glucoside, (AKA dodecyl glucoside) a non-ionic surfactant molecule.  Because it is non-ionic, it is a milder detergent, often used in cosmetics, shampoos, etc. Glycosides are produced from lauryl alcohol and glucose.

It may be possible to specially order detergents from companies like this one.  

Wednesday, February 04, 2015

H2S: A Toxic Gas, and an Important Metabolic Neurotransmitter!

Hydrogen sulfide, in addition to being a poisonous gas associated with oil and gas wells, plays a huge number of critical metabolic and neurotransmitting roles in the human body.

Source.  Hydrogen sulfide-based therapeutics and gastrointestinal diseases: translating physiology to treatments
Melissa V. Chan , John L. WallaceAmerican Journal of Physiology - Gastrointestinal and Liver PhysiologyPublished 1 October 2013Vol. 305no. 7, G467-G473DOI: 10.1152/ajpgi.00169.2013

Source.

Source.  Physiological Implications of Hydrogen Sulfide: A Whiff Exploration That BlossomedRui WangPhysiological ReviewsPublished 1 April 2012Vol. 92no. 2, 791-896DOI: 10.1152/physrev.00017.2011


Different signaling pathways in cardiovascular system modulated by H2S. AC, adenylyl cyclase; sGC, soluble guanylyl cyclase; PDEs, phosphodiesterases. The inhibitory effect is denoted with (−), and the stimulatory effect is denoted with (+).  Source: 


To research about a specific enzyme, the Human Metabolome Database HMDB works well.  To view maps of enzyme reactions, I recommend this interface: