Showing posts with label assessment. Show all posts

Monday, November 07, 2022

Tree Risk - notes

 Notes from Tree Risk Assessment Qualification (TRAQ) class taught by Kevin Eckert for the Arizona Community Tree Council.  October 2022 


About 25 people are killed each year by falling trees in U.S.


Removal should only be an option when mitigations are not sustainable.  We have an ethical obligation to do no harm.  The benefits of trees are important.  


A risk is meaningless without a time frame.


Imminent - if a tear in the tree is weathered, the failure is not Imminent

Probable - failure would likely occur during normal (expected/seasonal) extreme weather.

Possible - failure would likely occur during abnormal (hurricane, tornado, derecho, etc) extreme weather.


Wounds

Thicker sap trees tend to compartmentalize better

If sap is oozing, touch and smell it:

Sticky = ok, its sap

Sour = bacteria

Slimy or foamy = fungus

Wet = just water


Drought

Tree dying from bottom up is over-irrigation

Tree dying from top down is drought (under-irrigation)


Failure

Soil failure vs root failure:  roots in air or roots break and stay in ground


Codominant is not a fault.  

Included bark is a fault because weak area doesn't hold stems.  

Aspect ratio near 1:1 for codom stems is a fault because don't have enough wood to wrap around union.  This is common cause of failure in pines, especially CA fire investigations.


Decay

Worse on compression side and at the base.  Hollow poles are strong. Most stress in tree is around the shell, so sapwood carries most weight, not heartwood (which is more brittle).

Heartwood - least concern

Sapwood - will start seeing tip dieback. 2nd worst.

Root - will also see tip dieback.  Not too bad if not structural; crown dieback will balance root dieback.

Basal - worst.  


Types of Response growth:

Reaction wood from tension/compression

Flexure wood from movement

Wound wood - e.g. lip around wound. More growth shows more stress


Likelihood of failure increases/decreases based on load (e.g. wind exposure) / response growth


Stress

Reproduction is sign of stress in trees (plants):  orchard trees cut to fruit more, but decreases lifespan.


Vigor/health does not always reduce tree failure risk

Adding N can increase leaf area and stem elongation, but that can increase load on stem and if stem doesn't thicken then can increase tree failure risk, even while increasing tree "vigor".  Sometimes reducing growth (ie use growth regulator) can improve mitigations.


Sheer plane: where tension and compression meet


Cracks: transverse (fiber failure) or longitudinal (with the grain)


Age

Old trees: retrenchment = natural process of aging, shortening and widening = more stable


Trees naturally move with wind.  Mass damping shows importance of inner branches and leaves.  Helps tree stems "undulate like snake in the wind".  Sharp bends or lack of inner leaf area can inhibit natural movement.


Construction

New concrete can leach lime/calcium oxate which raises soil pH and can harm some plants if too much


Adventitious branches = "water sprouts" (from topping = non ANSI cuts) = epicormic.  Poor attachments can rip out.


Shigo said:  "don't err on the side of safety….just do it right!"  :: Do the best you can based on your education, training, and experience.  

Friday, March 27, 2015

Two Soils from the Manzano Mountains

Overview SOIL 1


Apparently frost -heaving has raised very weak physical (WP) crust-mounds.


Closeup of a crust mound:  The surface has been softened and the top centimeter has filled in with fine sediments.  This top layer actually has more structure than the frost-heaved material below it, which readily crumbles into its constituent soil particles.  Note the plant root, at top center of the photo, growing in the fine sediment layer.


Where litter is present, but too discontinuous to form duff, the action of frost heaving rapidly incorporates pine and juniper litter into the mineral horizon.


Overview SOIL 2


Some areas have much more biological crust than others.  In these photos, the blue grama grass Bouteloua gracilis (BOGR) is more abundant with denser cryptobiotic crust.  The darkened biological soil crust (BSC) consists of free-living blue-green algae such as Nostoc. 


Compact SP (strong physical) crust with roots and moisture evident underneath.  These cracked peds come up in 5-8 inch radius plates.  Note how different this crust is from the previous “frost-heaved” crust.  This crust has significant structure to it and doesn’t immediately crumble into constituent particles.  

Monday, September 15, 2014

A streamlined, GIS version of USDA's Environmental Benefits Index

USDA calculates the environmental benefits of applying conservation easements to farmland.  The University of Minnesota has developed an online tool for mapping three important components used by decision-makers to prioritize farmland conservation funding:

Soil loss is calculated using the Universal Soil Loss Equation, which factors in slope angle and distance, soil texture,

Water quality risk was calculated using a Stream Power Index, and proximity of land parcels to streams.

Habitat quality was calculated using by intersecting known stressors such as roads and development with known areas of high quality habitat, such as areas with endemic or endangered species, high biodiversity, and/or high game abundance.

The combined metric for all three layers generates the Environmental Benefits Index.
Screenshot from maptool from the EBI page of the Natural Resources Research Institute at the University of Minnesota.


Environmental Benefits Assessments for USDA Conservation Reserve Program

The USDA uses an  Environmental Benefits Index (EBI) to rank Conservation Reserve Program land applications by prioritizing soil conservation, water quality, and wildlife habitat.  Six factors are considered:
  1. Wildlife habitat benefits resulting from covers on contract acreage 
  2. Water quality benefits from reduced erosion, runoff and leaching 
  3. On-farm benefits from reduced erosion 
  4. Benefits that will likely endure beyond the contract period 
  5. Air quality benefits from reduced wind erosion
  6. Cost
1.  Wildlife habitat is determined by looking at planting composition (introduced or native), number and composition of species (more species, and more functional groups such as legumes, shrubs, trees, forbs, and grasses have higher value), and landscape context (strips, blocks or mixtures that form corridors or gaps).  Points are also available for providing pollinator habitat and for enhancing wildlife in areas high-priority areas.

2.  Water quality benefits are determined by whether or not the property is in a designated surface water quality impairment zone, the type of soil, potential soil erosion, and distance to major waterbodies.

3.  Not discussed.

4.  Enduring benefits are determined subjectively based on the probability that conservation will continue beyond the CRP contract.  For example, trees would be expected to live longer than the 10-year CRP contract.

5.  Air quality benefits are determined by calculating potential wind erosion (based on average wind speed and soil texture), whether the property is in a air quality nonattainment area, and the potential to sequester carbon in the soil by planting trees, shrubs, or grass.

For more information, see the CRP Farm Science Administration website at USDA.gov.


....USDA also periodically reviews the effectiveness of their programs using the Conservation Effects Assessment Project.  Data and papers can be found here.


Friday, February 01, 2013

Do endemic taxa correlate?

One of the main assumptions of many biodiversity assessments and conservation efforts is that biodiversity correlates across taxa. In other words, an ecosystem with high plant diversity might be expected to also harbor high lichen diversity, high arthropod diversity, and a great many birds, bees, and bloomin' confusion. 

If this assumption is true, than scientists could study one taxa, say lichen, and use the results as a surrogate for studying all of the other possible taxa. But a new study by Dr. Che-Castaldo questions this "surrogacy" assumption:

"Testing Surrogacy Assumptions: Can Threatened and Endangered Plants Be 
Grouped by Biological Similarity and Abundances?"

Abstract:

"There is renewed interest in implementing surrogate species approaches in 
conservation planning due to the large number of species in need of 
management but limited resources and data. One type of surrogate approach 
involves selection of one or a few species to represent a larger group of 
species requiring similar management actions, so that protection and 
persistence of the selected species would result in conservation of the 
group of species. However, among the criticisms of surrogate approaches is 
the need to test underlying assumptions, which remain rarely examined. In 
this study, we tested one of the fundamental assumptions underlying use of 
surrogate species in recovery planning: that there exist groups of 
threatened and endangered species that are sufficiently similar to warrant 
similar management or recovery criteria. Using a comprehensive database of 
all plant species listed under the U.S. Endangered Species Act and 
tree-based random forest analysis, we found no evidence of species groups 
based on a set of distributional and biological traits or by abundances 
and patterns of decline. Our results suggested that application of 
surrogate approaches for endangered species recovery would be unjustified. 
Thus, conservation planning focused on individual species and their 
patterns of decline will likely be required to recover listed species."


Similar conclusions have been reached by a other studies.  For example, Erhlich et. al. 2002 found that in subalpine meadows in Colorado, indicator taxa show no skill in predicting diversity of other taxa, even among phylogenetically related species (in this case, butterflies and moths).

Sunday, May 03, 2009

Bluewater upstream of 2008/2009 Restoration Work

Comments: Beaver Dams (current and historic), as well as rock slide debris creaet riffle pool complexes, overbank (not channelized) flow and side channels.

Heavily vegetated banks, but no/few deciduous woodies. Some bluestem and coyote willow further up (becoming more common/denser the further up the reach). Browsing : 100% explains lack of woodies. Good underbank cover, and possibly better overbank cover at the end of the growing season. Poor shading is cause of listing 404-d Temperature Impairment. Lots of mallards, but is there nesting habitat? Stable cutbanks. Rock ledges in this canyon create enhanced moisture habitats.

Water Q: 5,2 = 3.5
Hydrogeomorphology: 5,5,5,5,5 = 5
Fish Aquatic Habitat: 4,4,1,5,5,5 = 4
Riparian Vegetation: 5,5,4,5,5,5,3,1 = 33/8 = 4.125
Terrestrial Wildlife Habitat: 2,2,2,5 = 2.75

Average = 3.875


Species List and Notes:

2 Species of Juniper (Utah (osteosperma) and One-Seed (monosperma) taking over remnants of old floodplane from derelict relict cottonwood. dead cottonwoods perched on historic floodplain, but not really that much higher than the new, active floodplane.
Old Gooding Willow

stubby skink in high diversty meso wet meadow with cottonwood (many branched/browsed) sprouting, lots of digging (mole?). Tons of potato bugs. Lupine, Viola nephrophylla, Stellaria, horehound, Oenothera, Horsetail, Clematis, Thalictrum.

Patch-nosed snake (Thamnophis hammondii)
oak gambell.
maiden hair fern.
new mexico olive.
red spiney unknown
jeff reports others
cherry
rose
Borage= lapula, mustard, stellaria, rose, cherry with catkin berries (not open yet)
3 species of aquatic plants plus sedge and rush
wax currant
orange gooseberry
skunkbush sumac currant

Saturday, May 02, 2009

Example RSRA's from the Verde Valley, AZ

Examples RSRA's:
(Indicator scores are 1 - 5; 5 is highest)

--------------
Lower Camp Verde SRP

Water Quality
1.Algal Growth: 1
2.Channel Shading, Solar Exposure: 2

= 1.5

Hydrogeomorphology (Stream Form)
3.Floodplain Connection and Inundation: 1
4.Vertical Bank Stability: 4
5.Hydraulic Habitat Diversity:5
6.Riparian Area Soil Integrity: 5
7.Beaver Activity: 4

= 3.8

Fish/Aquatic Habitat
8.Riffle-Pool Distribution: 2
9.Underbank Cover: 2
10.Cobble Embeddedness: 2
11.Aquatic Macro-invertebrate Diversity: 5
12.Large Woody Debris: 2
13.Overbank Cover and Terrestrial Invertebrate Habitat: 5

= 3

Riparian Vegetation
14. Lower Riparian Zone Plant Community Structure and Cover: 3
15. Upper Riparian Zone Plant Community Structure and Cover: 3
16. Shrub Demography and Recruitment: 3
17. Tree Demography and Recruitment: 4
18. Non-native Herbaceous Plant Species: 2
19. Non-native Woody Plant Species: 4
20. Mammalian Herbivory (Grazing) Impacts on Ground Cover: 5
21. Mammalian Herbivory (Browsing) Impacts on Shrubs and Small Trees: 1

= 3.125

Terrestrial Wildlife Habitat
22. Shrub Patch Density: 3
23. Mid-Canopy Patch Density: 4
24. Upper Canopy Patch Density: 3
25. Fluvial Habitat Diversity: 4

=3.5

Overall Average: 3.0
---------

Agua Fria River Below Horseshoe Ranch
Water Quality: 2, 2 = 2
Hydrogeomorphology: 1,4,5,4,1 = 3
Fish/Aquatic Habitat: 3,2,3,5,2,4 = 3.17
Riparian Vegetation: 2,3,3,3,1,5,5,5 = 3.375
Terrestrial Wildlife Habitat: 2,4,2,3 = 2.75

Overall Average: 2.8

------------
Lower Clear Creek

Water Quality: 1,2 = 1.5
Hydrogeomorphology: 1,4,5,5,4 = 3.8
Fish/Aquatic Habitat: 2,2,2,5,2,5 = 3
Riparian Vegetation: 3,3,3,4,2,4,5,1 = 3.1
Terrestrial Wildlife Habitat: 3,4,3,5 = 3.75

Overall Average: 3.0

Friday, May 01, 2009

What is the RSRA?

RSRA, or Rapid Stream-Riparian Assessment, is a tool to quickly assess ecosystem health. The RSRA was developed and intended for medium gradient, medium-sized streams, ie cold-water fisheries on the Colorado Plateau. It is conceptualized as a stratified sample: Stream>Hydrologic Reach>Study Reach>Sample Transects>Indicators.

The 25 "indicators" are used as clues or warning signals to trigger further investigation. The indicators are grouped into 5 categories: the (equally weighted) categories are: 1) Water Quality, 2) Hydrogeomorphology, 3) Fish Aquatic Habitat, 4) Riparian Vegetation, 5) Terrestrial Wildlife Habitat, each of which contains 2 to 7 indicators.

The RSRA is dependent on identifying and understanding hydrogeomorphic context, as each indicator is rated from 1 (completely impacted, no value for wildlife) to 5 (absence of impact from humans). In order to adapt the protocol to differing streams, rather than categorize, the assessment's authors urge the user to only use indicators that are hydrogeomorphically consistent. The philosophy is to imagine the stream as unimpacted (or actually find a nearby Reference Reach) to compare the actual stream to the possible. This philosophy can lead to problems. For example, at Little Ash Creek we decided to ignore the historic floodplane, and base our work for Indicator #3 Floodplain Connection and Unundation on the actual flow regime, not the benches of old Gooding willow that are now campgrounds 5, 10, or 15 feet above the channel and its new braided floodplane. This contradicts the approach taken at Clearwater creek, where the new braided floodplane was considered bankfull, and the high campground terrace was considered the floodplane. Has the campground ever been flooded? Inconsistent assessment of indicators in the field is a problem, but the challenge is to be accurate as well as consistent.

It is also the hope of the authors that the protocol w0uld not be used to compare dissimilar systems (e.g. a high gradient stream to a low gradient stream). Instead, the number values serve to highlight individual stressors/indicators, rather than simplifying all systems into a high/middle/low value health hierarchy. This could be a problem for the way the methodology is currently implemented.

The RSRA is geared toward understanding and assessing wildlife habitat. For example, Indicator 5: Hydraulic Habitat Diversity teaches users to see types of animal habitat, or the world as animals see it. Wildlife need habitat diversity, and disturbed systems are usually simplified to point that certain animals can no longer survive there. So, the criterion for these features is: do they provide unique habitat, without which, a species or host of species would not occur or persist? Some example riparian habitat types include:

sidewater or edgewater : squaw fish habitat, back eddy oxygenated, but slower flow water striders, water bugs. not big enough to be lateral pool because isn't beaver habitat.

lateral pool: builds up a bar between main channel, deep(bigmouth bass, beaver colonize), deep enough to provide cover from predators

slackwater or backwater: water not being flushed, oxygen levels go down, chemistry changes, mosquito can develop, fish can't live here.

high velocity riffles: create oxygenated water. fish eggs require high oxygen, and riffles are usually cobble-floored (cobble is a better substrate for eggs than fine sediments)

low velocity riffle: rolling wave doesn't break

scour pool: focussed flow creates deep water, cover

side channel: must be active, must be connected both upstream and downstream

Tuesday, October 28, 2008

Arizona Riparian Council at Date Creek

From Arizona Riparian Council at Date Creek

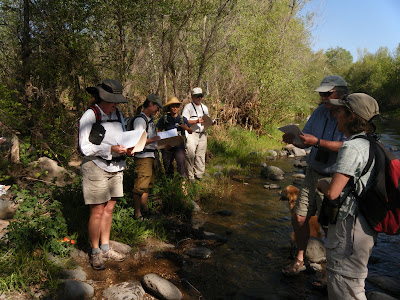
The Arizona Riparian Council meets yearly to discuss contempory issues in riparian restoration and resource management. This year we were lucky enough to tour Date Creek on the OX Ranch and Date Creek Ranch, and observe their various range management techniques, as well as discuss an assessment tool used to evaluate the sucess of their management.
From Arizona Riparian Council at Date Creek

The tool is called the Rapid Stream Riparian Assessment (RSRA) protocol. We discussed its applicability to Date Creek. Several of the issues that were raised were familiar from working with CNHP's Wetland Assessments: accuracy versus consistency, and what a number score really tells us about the present and future condition of an ecosystem.
From Arizona Riparian Council at Date Creek

What we are looking for in an assessment is quantitative, repeatable data for trend analysis, using a minimum of effort or professional training. The RSRA features sections on Water Quality, Stream Form, Riparian Vegetation, Terrestrial Wildlife Habitat, and Aquatic (fish) Habitat. It is focused on evaluating how well an ecosystem provides for wildlife.
From Arizona Riparian Council at Date Creek

Floodplane connectivity, or ratios of bankful to flood stage, are important measures of hydrologic function. High flows that flood over a large vegetated area better recharge Groundwater, Dissipate Energy (prevent scouring action), Leach Salt, Deliver Nutrients, and Establish Seedbeds.
From Arizona Riparian Council at Date Creek


The continued probably-natural disturbance of riparian areas might cause problems in assessments that focus on condition rather than process. The streams we witnessed, while averaging 3 out of 5 for most indices, was certainly recovering, with no major obstacles (invasive species, poor management) to prevent an eventual 5 out of 5 score, barring future natural disturbances.
From Arizona Riparian Council at Date Creek

I advocated a protocol based on ease of restoration. Quantitation would be done using dollars, rather than an arbitrary scale. Thus, a stream that needs $1,000,000 restoration could be compared to a stream like Date Creek that could, with no further inputs, recover completely.