Showing posts with label drought. Show all posts

Monday, April 13, 2026

"Average" Rainfall in Arizona

 NOAA National Water Prediction Service reports daily, weekly, monthly, seasonal, and yearly accumulated precipitation and the totals can compared to "normal".  Their data access website states that normal precipitation is defined as the 30-year PRISM normal from 1981-2010.  The Parameter-elevation Regressions on Independent Slopes Model (PRISM) climate mapping system developed at Oregon State University are considered the most detailed, highest-equality spatial climate datasets currently available.

But is the average still the same in the 16 years since 2010?

Methods

I downloaded total accumulated precipitation for water years ending September 30 for the last 10 years.  Unfortunately, the files for many of the years were corrupted and I was only able to look at the three years from October 2022-Oct 2025.  

I clipped the rasters to the Southwest US and took the mean for each grid cell.

Results

Over the last three years, some areas of the Southwest have had 50% of normal precipitation, and other areas have had 150% of normal. 

NOAA NWPS % of normal 2023-2025

Color key:


Zooming in to the area around Prescott, Arizona:

NOAA NWPS % of normal 2023-2025

Conclusions

Most of the area around Prescott is between 85-95% of normal (medium orange), confirming the presence of long-term drought.  Areas less than 75% of normal (dark orange/red) include much of the Bradshaw mountains around Prescott, the Dugas area along I-17, the Mogollon Rim - east of Payson and from Sedona to Ash Fork, and the south slopes of the San Francisco mountains around Flagstaff.

However, there are significant areas between 115 and 125% of normal (light green), including some areas above 125% of normal (dark green).  These above-average areas include the Juniper mountains and Upper Verde River, the Santa Maria river near I-93, a bit of Sedona and Schnebly Hill to Mormon Lake, and the north side of the San Francisco mountains. 

This shows how spatially heterogeneous average rainfall can be, and how a simple description of a state as being in drought or not can be misleading. For example, the excellent Drought Aware web app from Esri shows broad swaths of Arizona currently in drought, but my analysis shows that there is likely much more spatial variability.  

Thursday, March 06, 2025

The DRIP Model: Not Drought nor Deluge

How to find green growing plants in Arizona, a state famous for its long droughts and intermittent, but torrential, rains?  Previously I reviewed the available public models for drought, NDVI, and rainfall, and concluded that rainfall was most useful.  However, the most important factor for plant growth is regular consistent rain.  Not drought, but also not deluge.  I hypothesized that a consistent "drip" of at least 1/4 inch of rain each week would yield the best plant growth, and I created a GIS model to map this.  

Methods
lots more info at the bottom link for PDF: NWPS Products and User Guide

GeoTIFF The new QPE GeoTIFFs generated from the NCEP Stage IV data are multi-band GeoTIFF. The bands they contain are: 
● Band 1 - Observation - Last 24 hours of QPE spanning 12Z to 12Z in inches 
● Band 2 - PRISM normals - PRISM normals in inches (see Appendix A- Normal Precipitation) 
● Band 3 - Departure from normal - The departure from normal in inches 
● Band 4 - Percent of normal - The percent of normal

I only use Band 1, for the previous week, not 24 hours.

I download the data using a Power Automate FTP query for: concat('https://water.noaa.gov/resources/downloads/precip/ ', variables('Date2'),  '/nws_precip_', 'last 7-days_', variables('CurrentDate'), '_conus.tif')

In GIS, I Clip rasters to extent and calculate threshold (0.25") for each week:


Then I use Cell Statistics to add all threshold files for a several month period.

Results
10/13-12/01, each week gets 1 point for rain over 0.25"
Northern CA, and areas NE of AZ received more regular precipitation. This beginning of the water year period is important for early germination of desert winter annuals that can lead to "superbloom" springs.  Because most desert areas in AZ did not get much precipitation, the indications were not good for 2025 spring.

12/8 to 3/5, each week gets 1 point for rain over 0.25"
The highest mountains in UT and CO got regular precipitation, as did northern CA. NM did not continue wetter than AZ.  This winter period is important for desert spring ephemeral flowers.  While some areas of the Mojave did get rain, there was basically no rain in the Sonoran desert during this period. 

Thursday, September 21, 2023

Finding the Greenest Place in Arizona

 I love plants, and I love places where plants are happy.  But how can I find the greenest places, especially when I live in Arizona?

In the Southwest deserts, plant phenology and growth are dependent on intermittent rains.  But the rains can be variable between nearby areas. 

Rainfall totals and percent of normal can be viewed using https://water.weather.gov/precip/ This uses observed (radar) precipitation. 

Displaying Last 90-Day Percent of Normal Precipitation from Sep. 20.


However, more important than total rainfall over the growing season is timing of rainfall.  A single deluge that brought 3 inches last week to an area that hasn't seen rain in 6 months, is not as effective in stimulating plant growth as regular weekly or biweekly 0.5 inch storms.

A better approach to locating areas of high plant growth is using NDVI (Normalized Difference Vegetation Index), or observed "greenness" from satellites.  Data updates every week or couple of weeks, depending on the satellite.

But some areas, like forests, will always look greener than other areas, like deserts.  What we really want to locate are areas of anomalous greenness.

This UA webpage calculates departures from last week, last year, and from the average year.

VIIRS NDVI difference from average from Sep 6.

Other resources include the USGS Vegetation Drought Model, VegDRI.  The Vegetation Drought Response Index (VegDRI) shows seasonal drought impacts on vegetation. The weekly index is produced using a model trained on the self-calibrated Palmer Drought Severity Index using MODIS satellite-derived greenness anomaly integrated with precipitation, land cover, soils, and other biophysical data sets. Updated every Monday by 10 AM. 

VIIRS NDVI as shown by the USGS VegDRI model.

Clicking on the map generates a time series, which can be useful to compare seasonal and yearly changes at a location.

Graph of VegDRI drought index for a location in Yavapai County over the last 4 years.


The United Nation's FAO also maintains an NDVI anomaly drought mapper that uses the European satellite AVHRR.  However, the data is only provided at the scale of entire nations.  

So where is the greenest place in Arizona?  As you may have noticed from the screenshots above, that depends on who you're asking!  I hope to "ground-truth" some of these models to learn which are most reliable for greenness-hunting.

Wednesday, December 01, 2021

Prescott Water Supply

 The Citizen Water Advocacy Group has good resources discussing this issue.  Here's a video covering frequently asked questions.  


Well water levels are declining by more than 1 foot/year in the center of the aquifer, and have declined more than 100 feet in the last 80 years.  Wells at the edge of the aquifer, such as in Williamson Valley, are declining from 2 to 7 feet per year (data not shown).


2000-2021 Drought in the Southwest


The list of Drought Impacts:

D0  Forage is limited; soil is dry

Fire risk increases

D1 Plants are stressed; hillsides are unusually brown

Stock ponds and creeks are nearly dry; some springs are dry

D2 Water and feed are inadequate for livestock

Fire danger is high; fire crews are mobilizing

Little forage remains for wildlife; pine trees are losing needles

D3 Ranching operations are affected

Fire preparedness increases; fire restrictions are implemented early

Skiing tourism is low; snowpack is extremely low

Wildlife encroach on developed areas in search of food and water

Native plants are stressed

Livestock do not have adequate water; runoff is short; conditions are dusty

D4 Fire restrictions increase; large fires occur year-round

Vegetation green-up is poor; native plants are dying

Lakes, ponds, and streams are dry

Saturday, July 17, 2021

Manufactured- versus Local-Material Restoration


This is not restoration.

"Erosion control" plastic mesh has been washed downstream and wrapped around a sapling.


This is restoration:


Carefully-laid rock armors the entrance to a dry pool.  Balanced stones mark the location of human intention.

Tuesday, December 22, 2015

A New Precipitation-Evapotranspiration Index to Map Global Drought

Standardized precipitation–evapotranspiration index (SPEI) is precipitation minus potential evapotranspiration (Vicente-Serrano et al 2010).  It is distinguished from other drought indices because it accounts for temperature through modelled evapotranspiration. This website maps global drought:
Drought in the US 2010-2011.

SPEI has recently been used to predict pine mortality in SW forests.  When the SPEI is below -1.68 for at least 11 months, pinyon and ponderosa pines cannot grow and mortality soon follows. (Kolb, T.E., 2015. A new drought tipping point for conifer mortality.Environmental Research Letters10(3), p.031002.)

Long-term drought graph for NM.


Friday, December 18, 2015

2015 New Mexico Weather Recap

The ABQ NWS office has an excellent recap of the state's weather over 2015.  For example, here is their summary of the summer monsoon:

The 2015 monsoon season got off to a quick start with heavy rainfall, floods, flash floods and severe weather in mid and late June, as well as the first two weeks of July.  A relatively quiet period ensued for most of the remainder of July. A resurgence of heavy rain returned from very late July through early August.  An outbreak of severe weather was the dominate weather story in mid August, and to a lesser extent on September 9th and 23rd. 
products issued during monsoon season
By the numbers:  The Albuquerque NWS office issued 53 flash flood warnings between June 15 and September 30. 

The biggest news of the year was probably the good precipitation that finally ended the drought that began in early 2011:

Drought conditions developed across New Mexico in early 2011, with few breaks in the drought through 2012, such that much of the state was gripped in the worst drought episode since the 1950s.  Near normal statewide precipitation in 2013 and 2014 did little to improve the drought.  Much of the precipitation in 2013 and 2014 fell during the monsoon season, rather than the much more needed winter mountain snowpack.
Finally, New Mexico precipitation in 2015 was above normal for much of the year, and the period January through November was the fifth wettest on record since 1895.  As shown in the graph to the right, precipitation in New Mexico was well above average in January, May, July and October, with only two months below average - August and September.  These wetter than normal conditions supported a steady reduction in the intensity and coverage of the short term drought.  Finally, in early December 2015 New Mexico was drought free!  The last time the state was without any drought status was the week of November 23, 2010!
By the numbers:  New Mexico went 263 weeks with a portion of the state in moderate or worse drought!
NM monthly precipitation for 2015
  
 percent of new mexico in drought since 2011
 Source: U.S. Drought Monitor

Monday, January 19, 2015

Top Conservation Stories of 2014

Here are a few of the most important conservation stories from 2014:

--Gila River Proposed Diversion approved by ISC

--Mexican Gray Wolf critical habitat expanded to include most of NM and AZ south of I-40

Zone 1 is where Mexican wolves may be initially released or translocated.  Zone 2 is where Mexican wolves will be allowed to naturally disperse into and occupy, and where Mexican wolves may be translocated.  Zone 3 is where neither initial releases nor translocations will occur, but Mexican wolves will be allowed to disperse into and occupy....where Mexican wolves will be more actively managed...to reduce conflict with the potentially affected public.  However, in AZ east of Highway 87 there will be a "phased approach" to managing wolf populations.

--U.S. Congress Omnibus spending bill approves the Resolution mine landswap in AZ, grazing lease terms expanded to 20 years, and Valles Caldera becomes newest National Park

--Drought in CA (7% snowpack) ... and NM.  (e.g. Heron Lake resevoir levels fall, fail to make San Juan-Chame deliveries to Rio Grande)

-- US EPA and NRCS try to regulate agriculture under CWA....and fail.  The problem of increasing toxic algae problem in Ohio lakes came to a head in 2014 when Cleveland had to turn off their city water intake from Lake Eerie due to a toxic algal bloom. The proposed rule would have allowed EPA to regulate "non-point source" water pollution from farms that did not have a NRCS-approved conservation practices in place.  But apparently the outcry was too much, and early in 2015 the rule was amended.  Note that the final rule, even though it no longer contained this provision, was still vehemently protested in 2015.

--  Gunnison Sage Grouse listed as "Threatened" under the ESA, Colorado appeals.

-- Colorado River Pulse....mostly just grows more tamarisk.

--  Pleistocene megafauna extinction due to meteor impact, new study finds.  

-- Wilderness turns 50 years old

-- New "stacked trait" GMO potatoes and soybeans approved in the U.S.

And a random tidbit:  rabbits eat more forage in utah than bison...leading ranchers to question the state's continued bounty for coyote skins.

Wednesday, July 17, 2013

Friday, April 19, 2013

Three years of New Mexico Drought


Percent of Normal Accumulated Precipitation from the last 6 months.  from water.weather.gov

Here's the last 36 months:
 The CPC is currently predicting below average precipitation throughout NM during the monsoon July-August-September time frame.

Friday, March 01, 2013

Water Year

Now that it is March and the winter rains are almost finished, let's look at who got what.  The West remains in a deep drought.

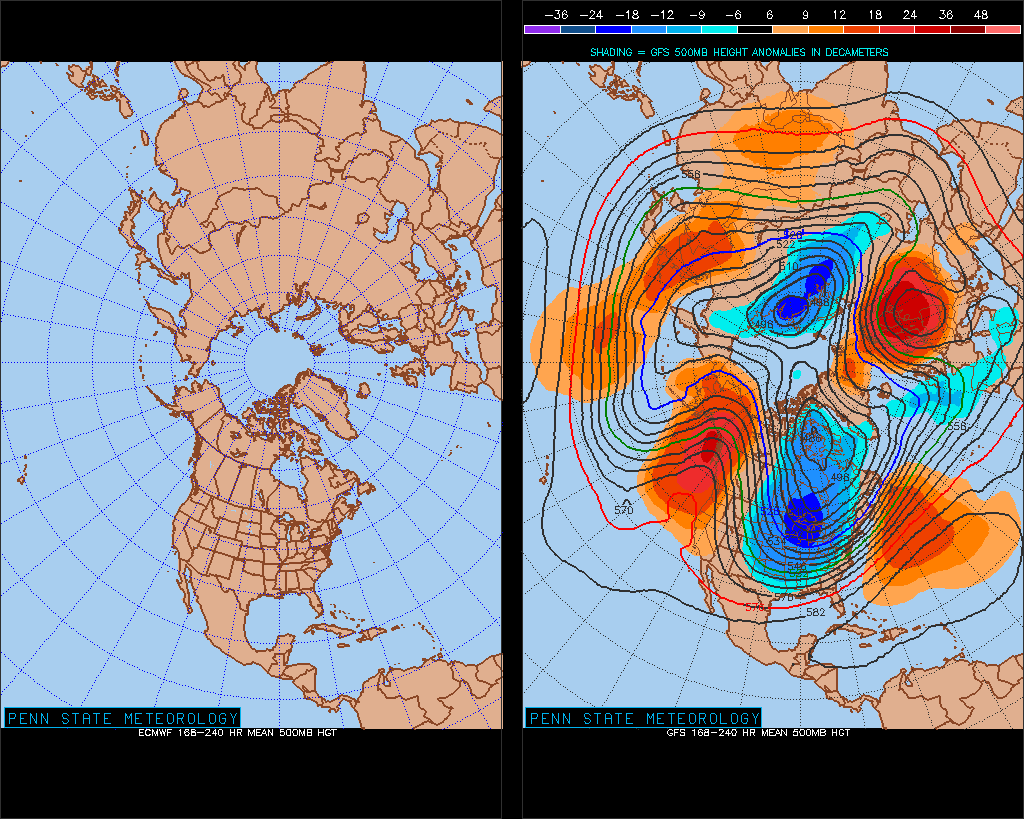
 Do Highs and Lows (e.g. 500mb height anomalies) force jet stream diversions or does jet stream bunching and coiling create ridge and troughs and hence Highs and Lows?


The Weather Channel notes that February upper-level (jet stream) synoptic pattern brought very cold air to the Eastern U.S.

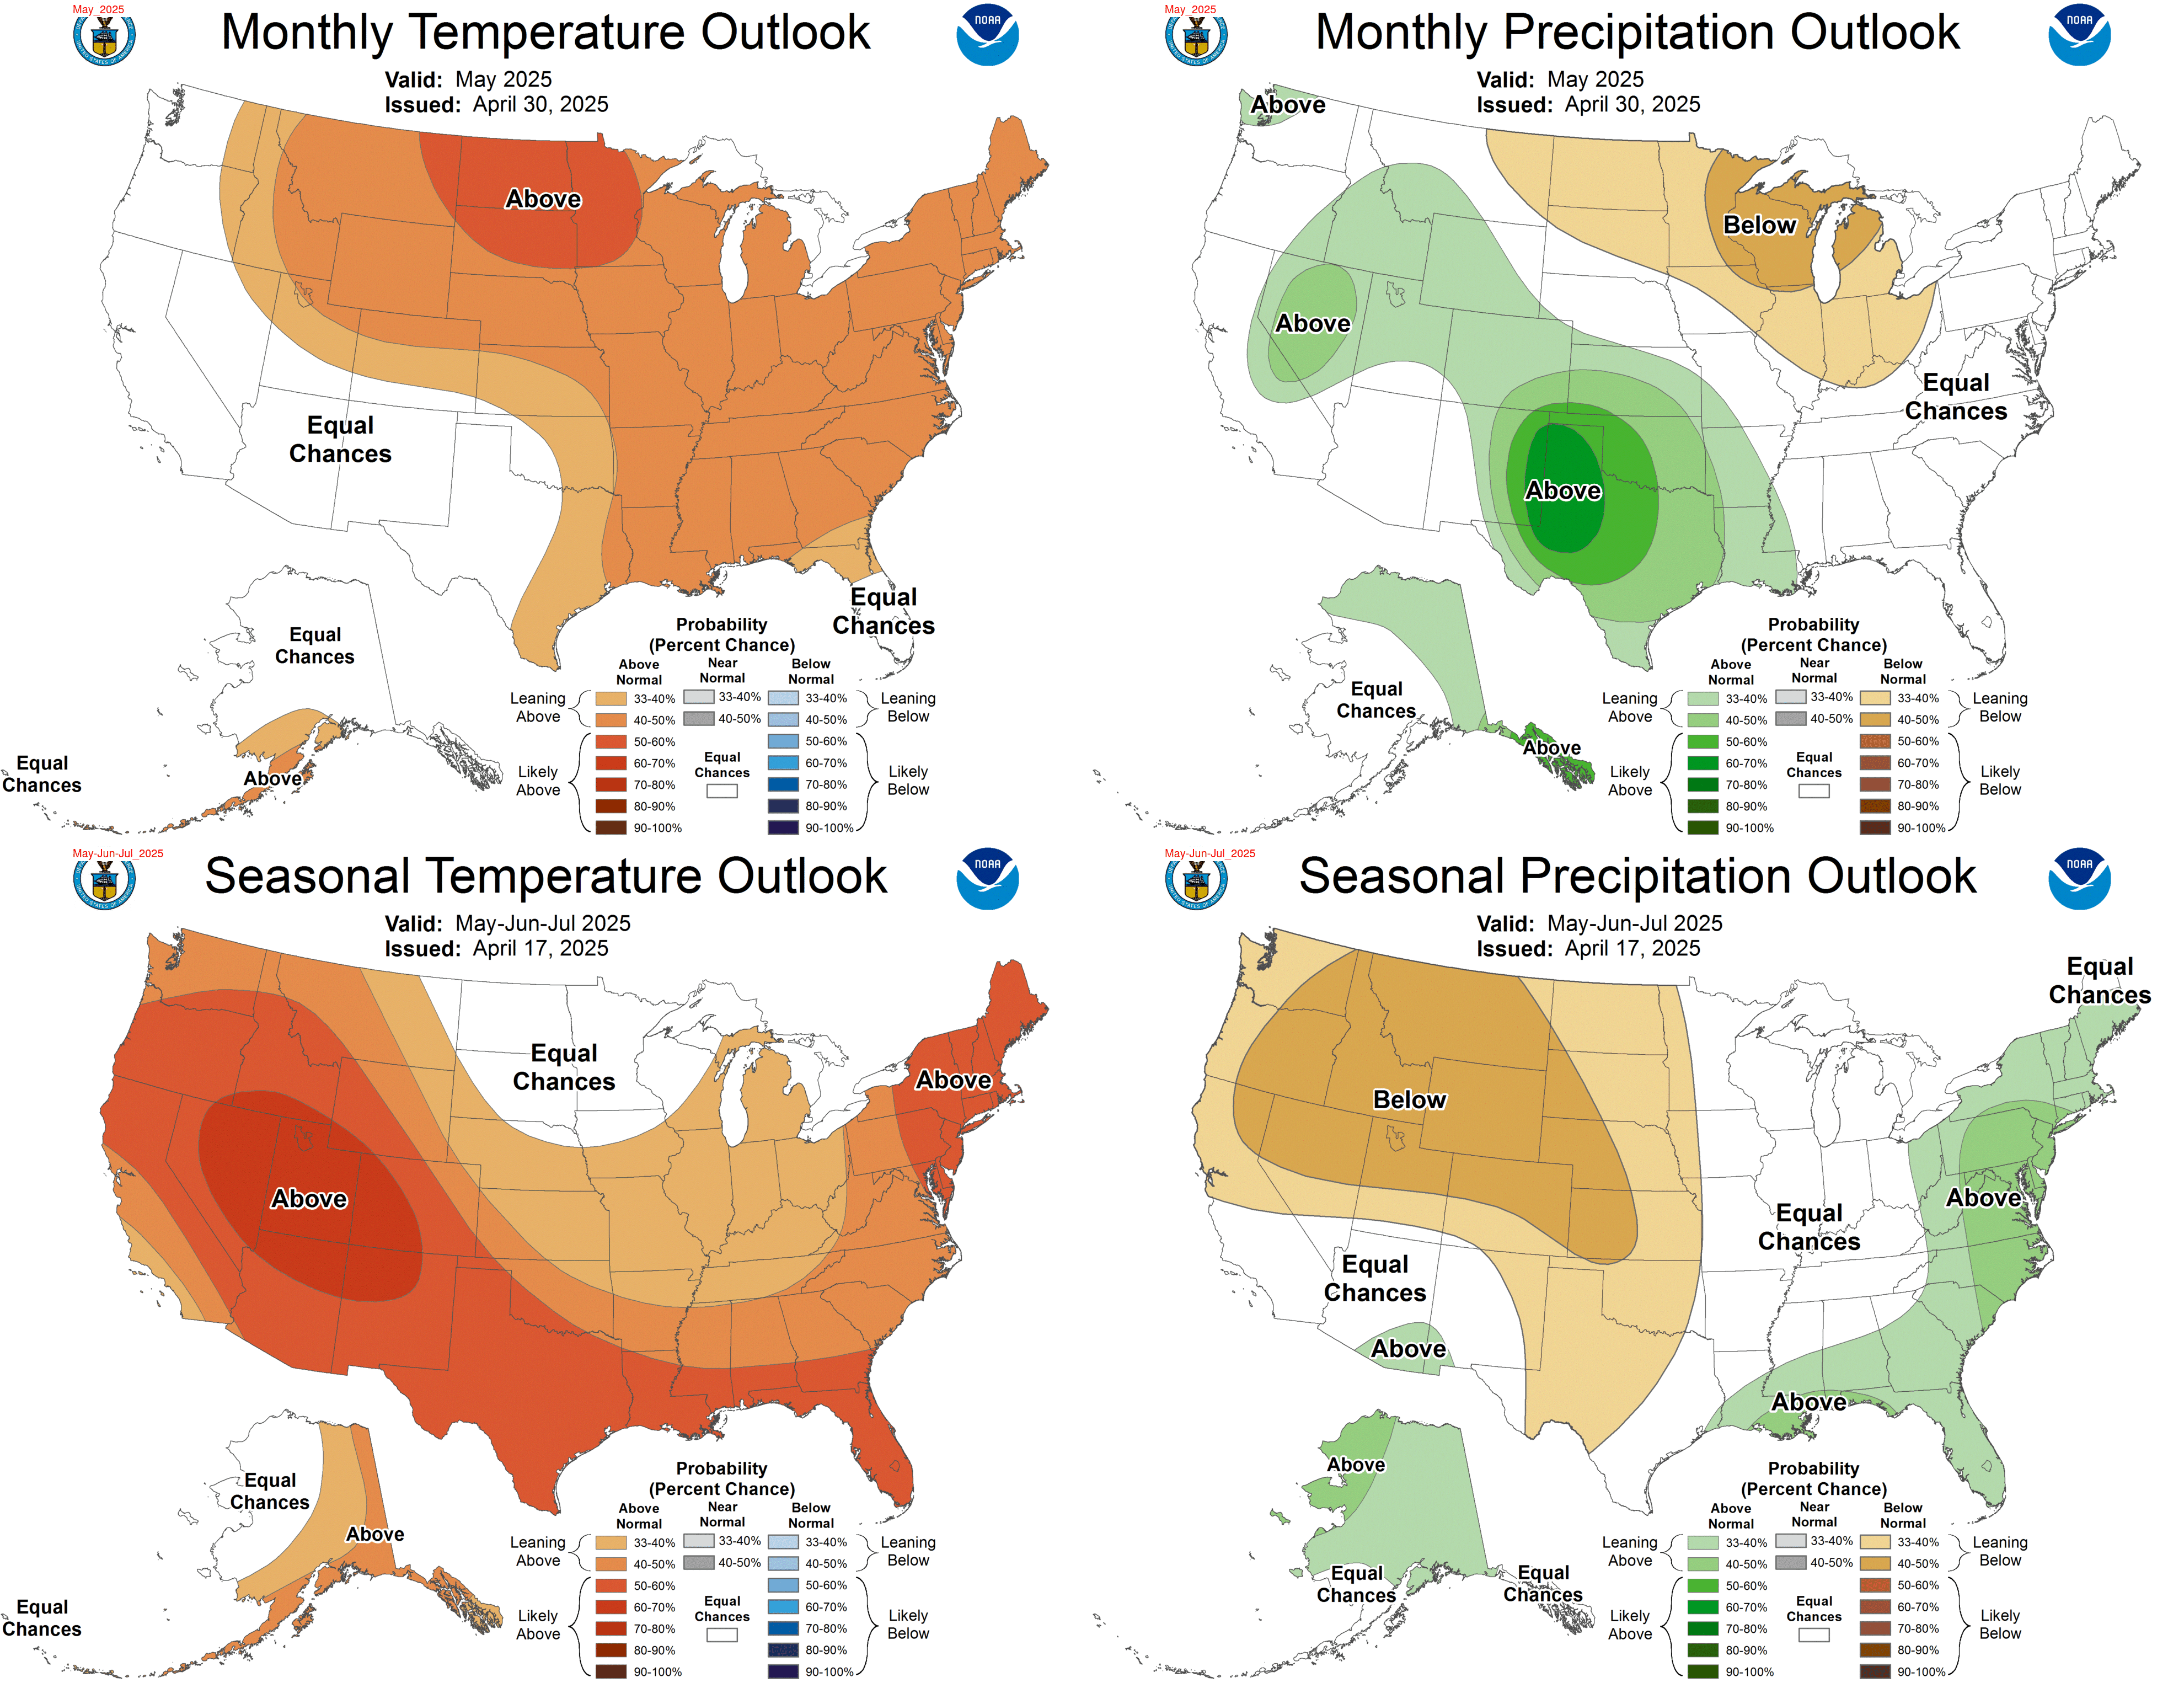
Looking ahead to May, they predict that the continuing drought in the Western Plains will continue and set up a feedback loop: drier surface conditions will create a bubble of high pressure air that will in turn influence the average track of the jet stream, pushing storms north of the rain-starved regions.  This is just one possibility, however, and even then only reflects average conditions.

Monday, April 20, 2009

Climate Change, by U.S. State

The climate is always changing, and here are the last 30 year averaged trends.


You can also see how the seasons are changing.

Friday, July 11, 2008

The Monsoon has begun (in Tucson)

The monsoon has begun in Tucson:
Source.This NOAA graph shows dewpoint, a measure of humidity. The blue line for this year is above the average, red line, and passed the 54 degree cutoff in early July. The monsoon is somewhat arbitrarily defined as any period of three or more consecutive days when the dewpoint is 54 degrees or above. In Tucson this kind of moisture only happens during the monsoon, when the wet tropical air pushes north. More info.
The rainfall so far has been above average as well. This graph does a good job of showing the variability of rainfall between cities that are less than 100 miles apart. When it comes from isolated thunderstorms, sometimes they hit you, sometimes they miss you.

The rain has not yet helped out New Mexico and Texas (source), but the climate forecast is for New Mexico to get a good amount of moisture over the next month:
Source.

Sunday, February 17, 2008

The Graph

The American West was colonized by Anglos during some of the wettest periods in the last 1,000 years, according to the February 2008 National Geographic. These abnormally wet years are depicted as mountains surrounded by valleys of drought in a graph of Colorado River Streamflow reconstructed using University of Arizona Lab of Tree Ring Research. The highlight denotes a 60-year drought that was consistently as severe or worse than the current (1998-2008) drought. Judging from the jagged oscillations of this graph, such droughts may be a regular and normal occurrence, although not for our modern water-spoiled civilization.

See also National Geographic News, "U.S. Drought Could Be Start of New Dust Bowl"