How to find green growing plants in Arizona, a state famous for its long droughts and intermittent, but torrential, rains? Previously I reviewed the available public models for drought, NDVI, and rainfall, and concluded that rainfall was most useful. However, the most important factor for plant growth is regular consistent rain. Not drought, but also not deluge. I hypothesized that a consistent "drip" of at least 1/4 inch of rain each week would yield the best plant growth, and I created a GIS model to map this.
Thursday, March 06, 2025
The DRIP Model: Not Drought nor Deluge
Friday, May 24, 2024
Joshua Trees Flower Episodically in Arizona
Intro
Joshua trees are large, visually-striking trees in the Mojave desert. Most of them are in California and Nevada, but there is also a population in the western part of Arizona. They are frequently photographed and there are more than 17,000 observations (1,000 in AZ) saved on iNaturalist, a website and app used to document biodiversity.
| Arizona Joshua Tree locations observed on iNaturalistiNaturalist. |
Joshua trees produce showy clusters of white flowers at the tips of their branches in March, but this year I noticed they were not flowering. I wondered how often they produce flowers and decided to answer this question using data from iNat.
| 53 observations in Arizona showed evidence of flowering, always in March and April. |
Methods
iNat observations of Joshua Trees (Yucca brevifolia) in Arizona were marked using the Plant Phenology option in the Annotation Field. Plant phenology (flower budding, flowering, or fruiting) was determined based on visual inspection of the saved photos in iNat.
| The iNat website has a nice phenology visualization tool. This view is filtered to show only Arizona observations. However, it cannot show differences in phenology from one year to the next. |
Observations were then filtered on the iNat Explore page by adding &term_id=12&term_value_id=13 to the URL and downloaded for analysis in Excel.
| More info about using iNat search URLs. |
Results
I graphed the results starting in 2017, because there are fewer iNat observations before 2017. It appears Joshua Trees flower episodically. According to this data, Joshua Trees flowered in four out of the last 7 years. They appear to alternate years from 2017-2020, but then skipped 2021 and flowered in both 2022 and 2023.
Friday, January 05, 2024
Land Development Releases Greenhouse Gases
Land use change releases stored carbon and should be counted under Greenhouse Gas (GHG) reporting.
Example of a wildflower meadow (left) that was bulldozed to create a parking lot (right). This land use change results in direct emissions of stored soil carbon and plant biomass, as well as continuing opportunity costs: the meadow can no longer accumulate sequestered carbon. If this land is owned by the developing company, this would count as Scope 1 Emissions under GHG reporting requirements.
New GHG reporting standards for land use change are due to be finalized in 2024. According to these new standards,
"Companies shall:
-Account for land use change emissions from land carbon stock decreases across all carbon pools (biomass, soil organic carbon and dead organic matter).
-Account for and report direct land use change (dLUC) emissions or statistical land use change (sLUC) emissions in scope 1, scope 2, and scope 3."
This is important because, according to the IPCC AR6 (2023), land use change accounts for approximately 15% of anthropogenic emissions. Interestingly, the parts of the land and ocean that have not been developed by humans still absorb 30% of our emissions. As we degrade more and more land and water, the Earth loses this buffering capacity, in addition to the extra emissions created from land use change.
Thursday, March 23, 2023
Climate Prediction Skill
The US Climate Prediction Center issues forecasts beyond the normal National Weather Service's 10-14 day window. They provide weekly and monthly forecasts out to 3 months. Given the timeframe and the fact that their forecasts cover the entire contintental US, its not surprising that the forecasts are often wrong. But how wrong? And is their skill improving over time?
I analyzed their 3 month temperature and precipitation forecast skill using data provided on their "Gridded Seasonal Verifications" webpage.
Note that skill is measured on a scale from -50 to 100, where -50 would be a forecast that was exactly wrong in every area, 0 would be a prediction that did no better than chance, and 100 is a prediction that was exactly right in every area.
They provide data starting in 1995. Since that time in the mid 1990's, linear trendlines show that their forecast skill has slightly improved for both Temperature and Precipitation. Precipitation skill started out lower, but has almost doubled (from 10 to 20) while Temperature skill started higher but has not increased as much (from 22 to 28).
However, the last 10 years have not been as successful:
Since 2012, neither Precipitation nor Temperature skill have increased. In fact, mean temperature forecast skill has decreased markedly since 2018. Before that, Temperature skill had been doing quite well in the period 2014-2018. It is not clear what changed in 2018. A similar transition may be happening with Precipitation, where the period 2019-2022 saw consistently good predictions, but since the beginning of 2023 the forecast skill has fallen off a cliff.
With increased use of machine learning, it seems likely that long-term weather forecast skill should increase. However, complex chaotic weather patterns are most impactful to climate predictions in the 1-3 month time frame, so this area of weather/climate prediction may continue to have lower than hoped for success.
Tuesday, September 28, 2021
2021 Arizona Monsoons
It was a good monsoon in AZ this year, with some locations up 8 to 12 inches above normal (June-September 8). But due to the uneven distribution of thunderstorms, even in this good year some areas barely received normal!
Wednesday, January 20, 2021
Monday, January 20, 2020
Australian Wildfires
![]() |
| Extremely large pyrocumulus clouds tower over bushfires in New South Wales and spread over the Pacific Ocean. Sentinel-2A image, December 31, 2019, processed by @andrewmiskelly. Source. |
"Fuels management cannot prevent fires but can change their behavior" but fuels management is limited by budgets and time to burn, especially in droughts." Source.
The BBC has a good overview:
"We’re seeing recurrent fires in tall, wet eucalypt forests, which normally only burn very rarely. A swamp dried out near Port Macquarie, and organic sediments in the ground caught on fire. When you drop the water table, the soil is so rich in organic matter it will burn. We’ve seen swamps burning all around."
"Even Australia’s fire-adapted forest ecosystems are struggling because they are facing increasingly frequent events. In Tasmania, over the past few years we have seen environments burning that historically see fires very rarely, perhaps every 1000 years. The increasing tempo, spatial scale, and frequency of fires could see ecosystems extinguished." Source.
More Info.
Australian Fire Center
Case Study / Educational Info
Sunday, January 05, 2020
Climate Change Belief Tree
An article in Nautilus magazine analogizes beliefs about climate change to branches on a tree. I like that the tree diagram emphasizes the unity of thinking about climate change, even if we may be on different branches. Also, I think it is OK for one person's beliefs to span different branches: belief about the future does not need to be certain but can be probabilistic and can change from one day to the next.
![]() |
| Diagram and original article by Summer Praetorius. |
The article concludes: "What if instead of feeling threatened by differences in opinion, we were to reconceptualize them in much the same way a tree will distribute a canopy to collect as much sunlight as possible—as a multi-pronged approach to getting the job done? In the same sense that both fast and slow processes contribute to Earth change, both steady progress and immediate local action will contribute to climate solutions. Let’s take stock of our pace and work together, thankful there is someone else to fill the space we can’t. After all, we are not lone trees, but a living, connected forest, and balance is essential for stability."
Thursday, December 26, 2019
Logging to Save a Forest from Climate Change
In the article, a researcher is quoted as saying that it would be irresponsible not to cut the trees because of climate change. "Aspen in the Great Lakes region are considered “climate change losers,” according to Nave, and are not expected to fare well as the region’s climate continues to warm in the coming decades."
"The high-emissions scenario projects an 11.2-degree Fahrenheit summer temperature increase in the assessment area by the end of the 21st century. At the same time, summer precipitation is projected to decline by 3.8 inches under that scenario. "
"It will take a decade or more to know which of the aspen-management treatments was most effective, Nave said. It is expected that future generations of Biological Station researchers and students will carry on with the work, he said."
Wednesday, September 28, 2016
Albuquerque 2016 Monsoon Season
| From the ABQ NWS Homepage. |
Monday, January 04, 2016
Bayesian Statistics
My favorite explanation of Bayesian statistics was by Nate Silver in The Signal and The Noise. The basic approach involves incorporating prior estimates of probability into new measures of probability. The opposing approach, which does not rely on prior knowledge, is termed "Frequentist" statistics and is exemplified Fisher's standard test used with p=0.05 (which implies that a given result would occur "by chance" only 5 in every 100 such tests).
Hogan uses the standard example of cancer tests to illustrate the importance and power of Bayesian thinking, but an astute commenter points out that the real power of Bayesian thinking comes when used in a process that tests, updates probabilities, and tests again, so that each test incorporates the learning from previous tests.
Silver offered a similar example in his book, but a review in the New Yorker points out that Silver got it wrong. In Silver's case, he applies Bayesian statistics to the probability that global warming is occuring. But the prior probability is estimated, and Bayesian approaches only improve on standard statistics when prior probabilities are well known. So while Silver does present a rational means of updating beliefs, since the original belief is not based on statistical data, the resulting analysis cannot be called statistically valid.
Both the New Yorker review and Hogan's thoughts highlight the inherent power of confirmation bias to trump any statistical test, even Bayesian tests.
Friday, January 01, 2016
Top Conservation of Stories of 2015
However, there were some problems. The gargantuan natural gas leak in S. Ca. highlighted the fact that natural gas leaks way too much to be a clean bridge fuel. We either need to clean up natural gas or resolve to skip over it altogether.
Tuesday, December 22, 2015
A New Precipitation-Evapotranspiration Index to Map Global Drought
| Long-term drought graph for NM. |
Friday, December 18, 2015
2015 New Mexico Weather Recap
| The 2015 monsoon season got off to a quick start with heavy rainfall, floods, flash floods and severe weather in mid and late June, as well as the first two weeks of July. A relatively quiet period ensued for most of the remainder of July. A resurgence of heavy rain returned from very late July through early August. An outbreak of severe weather was the dominate weather story in mid August, and to a lesser extent on September 9th and 23rd. | ||||||
By the numbers: The Albuquerque NWS office issued 53 flash flood warnings between June 15 and September 30.
|
The biggest news of the year was probably the good precipitation that finally ended the drought that began in early 2011:
Drought conditions developed across New Mexico in early 2011, with few breaks in the drought through 2012, such that much of the state was gripped in the worst drought episode since the 1950s. Near normal statewide precipitation in 2013 and 2014 did little to improve the drought. Much of the precipitation in 2013 and 2014 fell during the monsoon season, rather than the much more needed winter mountain snowpack.
Finally, New Mexico precipitation in 2015 was above normal for much of the year, and the period January through November was the fifth wettest on record since 1895. As shown in the graph to the right, precipitation in New Mexico was well above average in January, May, July and October, with only two months below average - August and September. These wetter than normal conditions supported a steady reduction in the intensity and coverage of the short term drought. Finally, in early December 2015 New Mexico was drought free! The last time the state was without any drought status was the week of November 23, 2010!
By the numbers: New Mexico went 263 weeks with a portion of the state in moderate or worse drought!
| ||||||
| | ||||||
| Source: U.S. Drought Monitor | ||||||
Wednesday, July 29, 2015
Wednesday, June 10, 2015
El Nino in the Spring
Thursday, March 05, 2015
Predicting Plant Phenology
![]() |
| Map from AHPS Precipitation Analysis from January and February |
![]() |
| Growing degree day map from PNWPest.org |
Tuesday, October 07, 2014
Scientific Statements Made by a Climate Change Skeptic
The article, written by Steven Koonin, includes a number of interesting statements and is worth a read in its entirety. Unfortunately, responses to the article have not addressed many of his factual claims, so I wanted to list a few of them here.
Please feel free to comment or link to research that addresses or refutes these statements:
1) "For example, human additions to carbon dioxide in the atmosphere by the middle of the 21st century are expected to directly shift the atmosphere's natural greenhouse effect by only 1% to 2%. Since the climate system is highly variable on its own, that smallness sets a very high bar for confidently projecting the consequences of human influences."
2) "But feedbacks are uncertain. They depend on the details of processes such as evaporation and the flow of radiation through clouds. They cannot be determined confidently from the basic laws of physics and chemistry, so they must be verified by precise, detailed observations that are, in many cases, not yet available."
3) "Although the Earth's average surface temperature rose sharply by 0.9 degree Fahrenheit during the last quarter of the 20th century, it has increased much more slowly for the past 16 years, even as the human contribution to atmospheric carbon dioxide has risen by some 25%. This surprising fact demonstrates directly that natural influences and variability are powerful enough to counteract the present warming influence exerted by human activity."
4) "Even though the human influence on climate was much smaller in the past, the models do not account for the fact that the rate of global sea-level rise 70 years ago was as large as what we observe today—about one foot per century."
5) "[these model discrepancies] are not "minor" issues to be "cleaned up" by further research. Rather, they are deficiencies that erode confidence in the computer projections."
Thursday, September 25, 2014
Hurricane Odile Rain in New Mexico
The area around Carlsbad Caverns in particular has had more than 20 inches in the last week, more than any other location in the U.S. Most of the precipitation influx stalled south of I-40, bringing scant relief for the dry second half of the monsoon we had in August.
![]() |
| September 18-25 Observed Precipitation resulting from Hurricane Odile. Source. |
Friday, September 05, 2014
Review of Soil Moisture Measurement Techniques
Advances in efficient, broad measurement of soil moisture are needed to understand plant stress response to drought. Crop growth and phenology can be predicted (link) with accurate modeling of soil-plant-atmosphere interactions. These dynamics are also crucial for advances in meteorology, since most rain that falls in the U.S. is recycled rain that has already fallen and evaporated at least once before, but often several times. Accurate prediction of rainfall will continue to elude meteorologists until soil moisture can be measured and predicted.
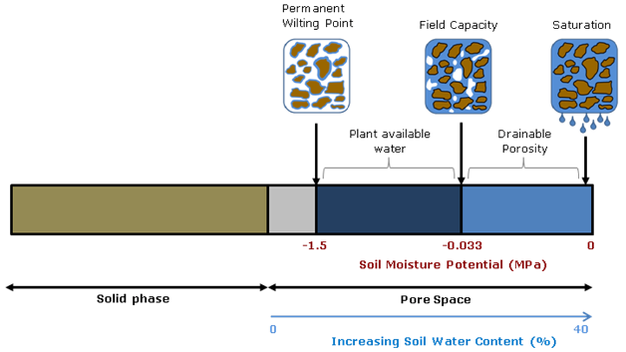
Soil moisture is critical for advancing plant and atmospheric sciences, but the fact that different measurement techniques yield different values points to the fact that soil moisture is essentially an abstract idea. While the water content of soil would seem to be straightforward, whether you calculate volumetric or gravimetric water content, and whether you consider chemically- and physically-immobilized water or only plant-available water (field capacity minus permanent wilting point) matters a great deal.
Diagram source.
Spatial and temporal scale also matters. Do you want an instantaneous point measurement, or a daily weekly average for an entire county’s drought status? Picking the right tool for the job means understanding the streghths and weaknesses of the entire gamut of technologies capable of reporting soil moisture. This article will start with traditional in situ point measurement techniques and continue to review broad-scale soil moisture modeling and remote-sensing efforts.
![]() |
| from Shuttleworth 2013 |
-
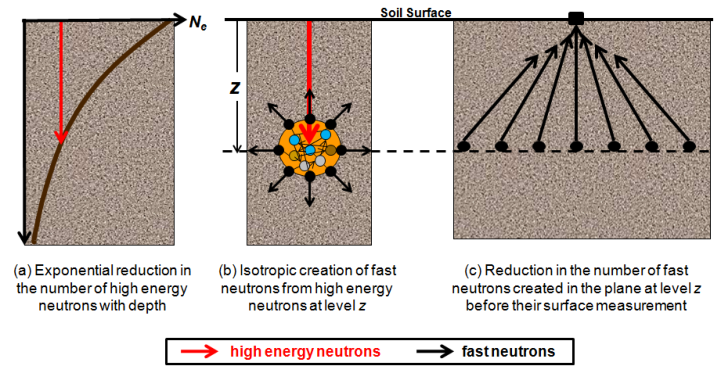
Meso-scale measurement can now be accomplished using the new COSMOS (Cosmic-ray Surface MOisture Sensor) program to measure whole ecosystem moisture. Neutron moisture probes have been around for decades but COSMOS uses advances in particle-physics technology to increase sensitivity enough to rely solely on the background cosmic radiation as a uniform source of neutrons. This advance makes possible, for the first time, instantaneous field-scale measurement of soil moisture.
![]() |
| Source. |
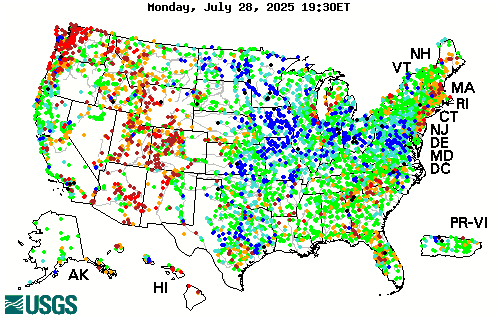
River flow data can reveal how much water is running off or through the soil from watersheds, so using a site like the USGSstreamflow network is a good proxy for large-scale short-term drought and deluge.
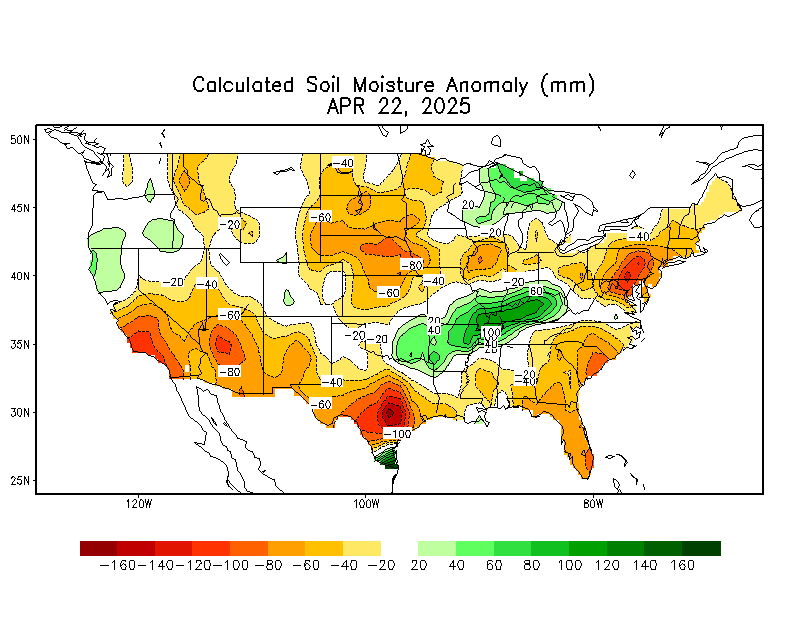
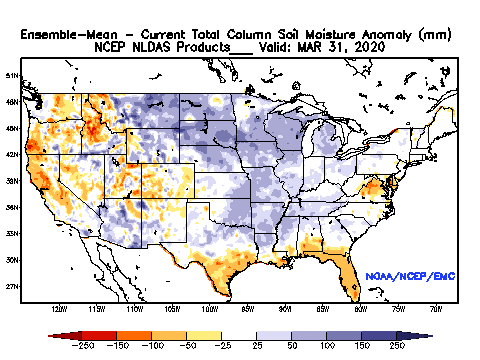
The National Land Data Acquisition System is developing a more accurate model of soil moisture that incorporates soil textural properties and average percent vegetation (which impacts evapotranspiration). The precipitation data used in the model is at approximately 25km resolution, interpolated to 13km grid cells: