Showing posts with label fire. Show all posts

Thursday, September 26, 2024

Fire Frequency in Arizona Ecosystems


Introduction

How likely a given area is to encounter wildfire is important for planning and wildfire mitigation. Historic or expected fire return statistics are often cited for ecosystems in Arizona, but I was curious how often wildfire actually burns across different Arizona ecosystems.

Figure 1 Example wildfire polygons around Clints Well, AZ showing overlapping fires from newer (blue, labelled), to older (shades of brown, unlabelled).  Data sources include WFIGS and GeoMAC.

Wildfire Data

I used the WFIGS Interagency Fire Perimeter GIS data, which has good data on wildfires from 2000-2023.  I limited this analysis to USFS land in Arizona.

Out of a total of 11.168 million acres of USFS land in AZ, wildfire has burned 4.8 million cumulative acres in the last 24 years.  This counts areas that burned more than once as additional acres.  It includes natural and human-ignitions, as well as wildfire managed for resource benefit.  

Figure 2 Example WFIGS Interagency Fire Perimeters in AZ


Figure 3 Wildfire acreage over time in AZ.  2011 was the Wallow fire.

Vegetation Types

To evaluate wildfire probabilities in Arizona ecosystems, I looked at the 15 most common ecosystem types, as defined by the USFS Ecosystem Response Unit (ERU) vegetation type GIS layer.  Together, these 15 ecosystems account for 9.1 million out of the 11.1 million acres of USFS land in Arizona.

Figure 6 Example ERU polygons showing aspen (pink) and mixed conifer around the San Franscisco Peaks, AZ.

To calculate the percent of each ERU burned per year, I divided total acres burned by total acres of ERU and divided that by 24 years.   Spruce-Fire forest and Mixed Conifer is most likely to burn, whereas Mixed Conifer with Aspen is least likely.  Ponderosa pine ecosystems rank in the middle, at around 3% chance. 

This analysis counts acres more than once if they burned more than once in the 24 year time period.  For example, Spruce Fir Forest ERU has more acres of wildfire than there are total acres of ERU.  This does not mean that every acre burned, but some acres burned more than once.   

ERU

ERU Acres

Wildfire Acres

% burned in 24 years

% burned per year

Ponderosa Pine Forest

1,966,603

1,431,424

72.79%

3.03%

PJ Woodland

1,175,545

208,685

17.75%

0.74%

PJ Evergreen Shrub

1,136,221

311,254

27.39%

1.14%

Mojave-Sonoran Desert Scrub

779,939

386,363

49.54%

2.06%

Semi-Desert Grassland

730,015

300,189

41.12%

1.71%

Interior Chaparral

713,754

533,678

74.77%

3.12%

Juniper Grass

539,830

299,074

55.40%

2.31%

Colorado Plateau / Great Basin Grassland

367,114

41,812

11.39%

0.47%

Ponderosa Pine – Evergreen Oak

362,838

238,365

65.69%

2.74%

Madrean Pinyon-Oak Woodland

354,836

92,160

25.97%

1.08%

Mixed Conifer - Frequent Fire

349,006

304,104

87.13%

3.63%

Mixed Conifer w/ Aspen

242,169

9,782

4.04%

0.17%

Montane / Subalpine Grassland

157,163

92,461

58.83%

2.45%

Spruce-Fir Forest

112,827

124,593

110.43%

4.60%

PJ Grass

96,016

8,995

9.37%

0.39%

Madrean Encinal Woodland

93,939

23,092

24.58%

1.02%

Figure 7 ERU acres, wildfire acres, percent burned in 24 years, and percent burned per year.  Table ranked from most to least common ERU.


Wildfire Return Interval

Fire return interval is the average length of time until fire returns at a given point in the landscape.  The chance that any given acre burns depends on a large number of complex factors, including when it last burned, the topography, fuel reduction treatments, proximity to WUI and/or human use.  Still, percent burned per year in the table above (Wildfire/Year, W) can be used to calculate expected return intervals of fire, all else being equal.

Calculations – Fire per Year

To calculate expected return intervals, first calculate the probability (P) that fire will not occur in a given span of time (X).

P = (1-W)^X

For example, for Ponderosa Pine Forest over 10 years:

P = (1-0.0303)^10

P = (0.9697)^10

P = 73.5% chance that fire will not occur, or 26.5% chance that fire will occur in 10 years.

20 years:

(0.9697)^20=54% chance that fire will not occur, or 46% chance that fire will occur.


Figure 8 Cumulative probability of wildfire in AZ Ponderosa Pine ERU


Calculations – Fire Return Interval

If we determine a Probability, but need to know the span of time until fire occurs, we can solve for X:

P = (1-W)^X

P = log x / log (1-W)

For example, if we determine "expected return interval" to be the length of time necessary for 50% chance of fire:

 0.5  = (0.9697)^X

X = log (0.5) / log (0.9697)

X = 22 years until there is a 50% chance of fire in Ponderosa Pine Forest.

However, if we interpret "expected return interval" to be the length of time necessary for 90% chance of fire:

0.1  = (0.9697)^x

X = log (0.1) / log (0.9697)

X = 75 years until there is a 90% chance of fire in Ponderosa Pine Forest.

Over time, the probability approaches, but never actually reaches, 100% that a wildfire will occur:

Figure 9 Cumulative Probability of Fire in Ponderosa Pine ERU


Conclusion

The length of time until fire returns at a given point in the landscape depends on how certain we want to be of the chance of fire.  If we want to be very certain (90% probability), then we would expect to wait 75 years on average.  If we are OK taking the flip of a coin (50% probability), than we would expect fire to return at any given point in 22 years.  If we are risk adverse, and can only tolerate a 10% chance of fire visiting our chosen point, we should expect fire every 3.5 years, on average.

Monday, October 31, 2022

Fire Retardant Visible From Space

The Bush Fire started on the West side of Highway 87 in Arizona on June 13, 2020.  Drive by strong winds from the SW, it soon spread to the highway median and then crossed to the East side of the highway.  From there, it went on to burn 193,000 acres until it was completely contained on July 6, 2020.
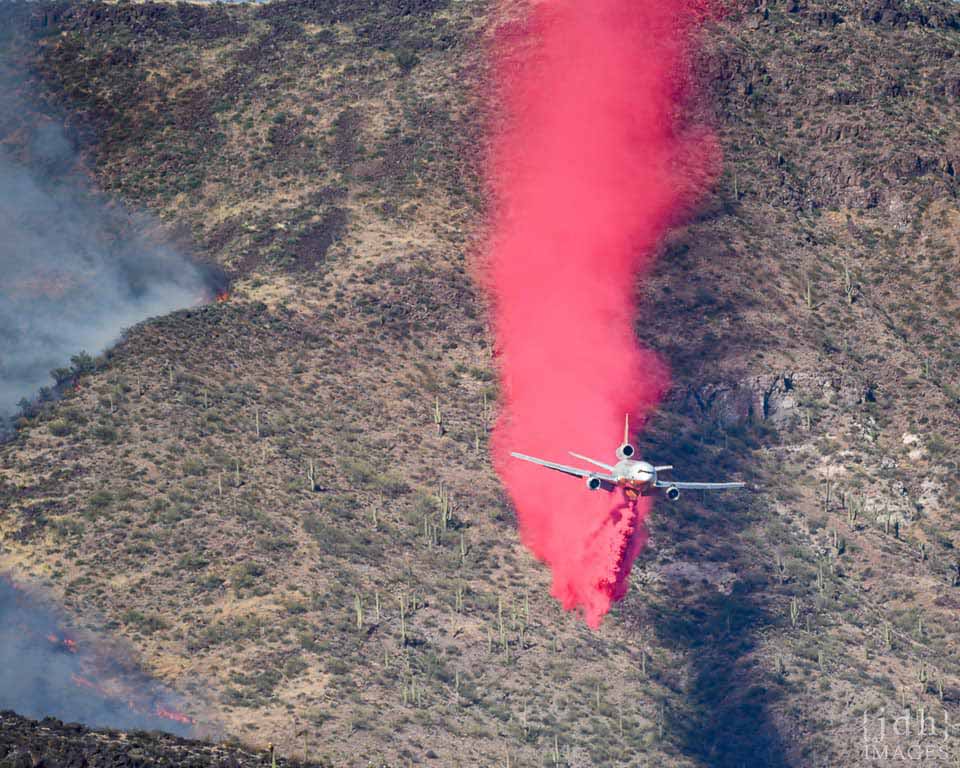
Air tanker drops retardant ahead of fire.  Photo by JDH images.  https://wildfiretoday.com/tag/bush-fire-in-arizona/

Air tankers were extensively used in the initial attack on the fire, and Google Earth images of the fire start location show some interesting features.  These images were taken on June 20, 2020, 7 days after the fire had burned this location.

The fire started on the West side of 87.  Fire retardant strips are visible in several locations.

Where the fire was backing against the SW wind, retardant drops were successful in stopping the spread of the fire.  A small bulge near the top of the image shows where fire crossed the line, but was contained.

Retardant drops on the south side of the fire were not successful in stopping the fire, but may have been instrumental in slowing the fire which allowed it to be stopped at the dirt road.

Retardant drops directly in front of the wind-driven fire were not successful in holding against the onrushing flames.  The fire spread over and around the retardant line in this image.

At another location on the same date, the fire can still be seen actively burning.


Tuesday, October 19, 2021

2021 California Wildfires and Fuel Treatments

This post and discussion on The Smokey Wire is one of the best, with in-depth reviews of the effectiveness of forest thinning to control wildfires.  


https://forestpolicypub.com/2021/09/17/the-caldor-fire-and-fuel-treatments-sf-chronicle-la-times-and-sac-bee-stories/

Monday, January 20, 2020

Australian Wildfires

Extremely large pyrocumulus clouds tower over bushfires in New South Wales and spread over the Pacific Ocean. Sentinel-2A image, December 31, 2019, processed by @andrewmiskelly.  Source.
A pyrocumulus cloud is produced by the intense heating of the air over a fire. This induces convection, which causes the air mass to rise to a point of stability, where condensation occurs. If the fire is large enough, the cloud may continue to grow, becoming a cumulonimbus flammagenitus which may produce lightning and start another fire.  Source.


"Fuels management cannot prevent fires but can change their behavior" but fuels management is limited by budgets and time to burn, especially in droughts." Source.

The BBC has a good overview:


"We’re seeing recurrent fires in tall, wet eucalypt forests, which normally only burn very rarely. A swamp dried out near Port Macquarie, and organic sediments in the ground caught on fire. When you drop the water table, the soil is so rich in organic matter it will burn. We’ve seen swamps burning all around."

"Even Australia’s fire-adapted forest ecosystems are struggling because they are facing increasingly frequent events. In Tasmania, over the past few years we have seen environments burning that historically see fires very rarely, perhaps every 1000 years. The increasing tempo, spatial scale, and frequency of fires could see ecosystems extinguished." Source.


More Info.
Australian Fire Center
Case Study / Educational Info

Monday, August 24, 2015

Smoke from WA Wildfires Reaches Albuquerque, New Mexico.

The smoke from large wildfires burning in NE Washington, N Idaho, and N. Montana reached as far as Albuquerque, New Mexico on Sunday morning.

The smoke covers a large part of the Western U.S.

Cliff Mass has excellent reporting on the smoke from the WA wildfires.

Airquality.weather.gov has the best air pollution monitoring data.  The AIRPACT website has high-resolution models of smoke production and transport in the PNW.

U.S. Wildfire Activity Map.  From ESRI.

Wednesday, April 08, 2015

Four Forests Restoration Project

The draft EIS for the first 500,000 acres has been released.


Thinning work is already ongoing, but is behind schedule:

"The company said it is now thinning about 30 acres a day, which works out to about 625 acres a month. That’s a significant increase in the pace of operations since January, but still far behind the schedule established for the project nearly four years ago.  Ultimately, the company’s 10-year contract with the Forest Service requires it to clear 40,000 acres annually. In the nearly two years the company has had the contract, it has cleared about 3,700 acres. That puts the company about 70,000 acres behind the original schedule."

In my experience, in the Jemez, the major time lags are for completing NEPA and EIS and waiting for good prescribed fire weather.  Cutting the trees is fast and easy, and if they skip the fire (unnecessary and possibly environmentally detrimental) nothing should slow them down.  One of my other main criticisms from the Jemez is that they're not thinning enough trees to reduce the basal area to the most beneficial levels.  I know the ideal density and pattern of trees has been argued about ad infinitum... it seems they are trying to avoid conflict by cutting less trees, which totally defeats the purpose of preventing catastrophic crown fire.

Monday, April 06, 2015

Fence Line Contrasts

Sitting on the fence has become a metaphor for ambivalence, but actual fence lines are some of the clearest lessons in land management.  Fencelines can be the best place to study ecology, because most fences divide two different land management histories.  The easiest places to learn from fence line contrasts is where the land management history is known.  For example, along highway right-of-ways (ROWs), the strip of land between the road and the fence is almost never grazed, whereas the private or public alotment on the other side of the fence has almost certainly been grazed and/or farmed.

However, just because the ROW hasn't been grazed doesn't mean that it has escaped disturbance. While comparing two disturbed areas can yield some insights, the multiple factors at work will make cause and effect deductions extremely difficult. To find a good comparison, look for areas that are relatively far from the road; immediately adjacent to the road is a zone of disturbance, which can include vehicle traffic, trash, mowing, and runoff from the road (i.e. increased moisture).

The best comparison areas occur where the ROW is relatively higher than road (so there is no possibility of runoff and little chance of other human disturbance).  However, areas with cutbanks below them are not good for comparisons, because of excess erosion, different microclimates around bare rock or exposed subsoil, and lowered water table.   A zone of depression in soil moisture can also occur around ditches, trenches, gullies, roadcuts, etc.

The actual fence-line itself may have different species due to fence-line drip of dew and the ability of fences to catch seeds, especially tumbleweeds. (photo).

On the ground immediately beyond the fence there may be an area of extra disturbance due to cattle trails, etc, and any areas near stock tanks or gates are also likely more heavily used (and hence a more extreme contrast).  In cases with less grazing on the private land, such as on steep hill slopes, vegetation and soils may look quite similar across fence-lines.  Of course, there will always be variable disturbance on both sides of the fence, but that is part of the challenge and opportunity of observing fence-line contrasts.

The best comparisons are between areas relatively far from disturbance, close to but not immediately adjacent to the fence-line.  With a good undisturbed ROW as a control, the vegetation on the other side of the fence can be compared to the potential climax community of the site.  

Case Example:

I was recently watching fence-lines along NM highway 285 from Vaughn to Clines Corners, and noticed that typical overgrazed areas are Grama Grass (Bouteloua gracilis) monocultures or low-stature annuals with large amounts of bare dirt.  The ungrazed roadsides still have bare ground, but the vegetation has a starkly different structure and composition:  multiple grass species occur with different growth forms.  But even more noticeable than the grass growth is the shrub encroachment in an area that is pure grassland.  Without fire or grazing, woody growth, especially saltbush (Atriplex canescens) and  Chimisa (Ericameria nauseosa) increases markedly.

While some trees and shrubs (e.g. E. nauseosa) are resistant to grazing when mature, their seedlings are highly palatable.  Cows can completely eliminate woody overstories from riparian areas in a single generation simply be eliminating recruitment (through both grazing and trampling) of Cottonwood and Willow seedlings.  Grazing pressure on seedlings is important, but easily overlooked: as long as there are trees, we describe an ecosystem as a forest. And it may seem strange to say that cows are eating a forest. But without seedling regeneration, no ecosystem is sustainable.

That grazing impacts woody growth as much or more than herbaceous growth is well-known along rivers and wetlands, but I think has been less remarked on in uplands.  From this brief study of fence-line contrasts, it appears that even more of our grasslands would support shrublands were it not for either grazing or fire limiting woody plant establishment.

Wednesday, September 03, 2014

Smoke from Jemez Mountains Controlled Burn Impacts Albuquerque

The fire was caused by lightening in the foothills of the Jemez Mountains more than two weeks ago. Instead of suppressing the fire, managers have used the smoldering blaze to burn out undergrowth and unhealthy Ponderosa thickets. While the forest is moist enough to preclude any danger of catastrophic fire, that moisture may also increase the amount of smoke.


Last night smoke from the fire drained down the Jemez River valley and into the Albuquerque metro area. By this morning the smog was visible as a distinct haze in the valley. Clear skies and dry air probably helped establish an inversion that contained the smoke within the valley. The smoke quickly dissipated once daytime convection began.

ABQ Journal Photo
The Albuquerque branch of the National Weather Service noted that the "smoke event" this morning was "dense" and "impactful".  Some politicians have used the smoke to argue against this type of forest restoration.

 The NWS does not expect smoke to be as bad today as it was yesterday. But on a recent update to Inciweb, fire managers note that "hand and aerial ignitions will be used again today to direct the wildfire over an area similar in size to yesterday’s activity. Large columns of smoke from this ignition will be visible..."

Current air quality information can be found at http://www.nmenv.state.nm.us/aqb/PinoFireInformation.htm.


Saturday, January 18, 2014

Salvage Logging is Not Supported by Published Research

I completed a literature review on the effects of salvage logging (SL). I read all of the major papers, including the two extant literature reviews, the old Forest Service-funded one by McIver and Starr, and the newer one by conservation ecologists Lindemeyer and Noss. The conclusions are consistent: in general, SL increases fire risk, increases erosion, reduces wildlife habitat, and impairs natural recovery. SL has the potential to be much more detrimental than traditional (green) logging (Lindenmeyer and Noss 2006).

This Ponderosa Pine forest burned in a the Las Conchas fire, a stand-replacing crown fire in the summer of 2011.  Two years later, grasses and flowers had recolonized the area.  Cover values were greater than in nearby unburned forests;  forests can recover naturally from even very severe fires.  
 *Increased fire risk:  salvage logging provides the kind of fuels necessary to introduce ground fires into the canopy (Donato 2005). SL increases fuel loads for 20 years compared to controls (McIver and Ottmar 2007).
These burned trees will gradually decay and fall to the forest floor.  Some burned trees may take as much as 50 years to fall, providing valuable wildlife habitat all the while (Lindenmeyer 1997). If they were logged, most of the limbs and crowns would be left as "slash" that, if re-burned, would yield extremely high flame lengths and soil temperatures.
*Increased erosion: salvage logging has the potential to exacerbate erosional problems typically observed in burned watersheds (McIver and Starr 2000).
Natural post-fire erosion can deplete soil, further impairing vegetative recovery.  Human disturbance can compact soils and channelize flow paths, thereby exacerbating natural erosion.  

 *Reduced wildlife habitat:  Most wildlife species rely on dead trees in one way or another.  Of the 102 terrestrial vertebrate species in Washington State, over half (56) require dead tree boles (snags) to nest or den (Hutto 2006). Across the West, 150 species of vertebrates rely on dead trees for nesting or denning (Rose et al 2001).
Less than three months post-fire, bark beetles in the Jemez Mountains, NM were so active they created large piles of sawdust.  Needless to say, woodpeckers were extremely active in this area.

 *Impaired natural vegetation recovery: SL results in increased mortality of pine seedlings (Castro et al 2011).
A pine seedling emerges from the burned forest floor one year after a fire (with a little natural fertilizer thrown in to help).  This seedling would likely be crushed (and the elk dispersed) by salvage logging, necessitating an expensive tree-planting operation to compensate for destroyed natural recruitment and depleted natural fertilizers.
Yes, forest fires are a major natural disturbance to forest ecosystems.  But despite all the talk of unnatural "megafires", even the largest and hottest fires leave some legacy of the previous forest (e.g. burned trees). Logging is also a major disturbance to natural forest ecosystems, a disturbance that burned forests are less resilient to.  Multiple disturbances have cumulative effects on ecosystems, so compounding the damage to a burned forest by removing the remaining trees is much more damaging than logging without fire.

Going forward, there needs to be broader recognition of the ability of ecosystems to recover from natural disturbances and the essential role of biological legacies (in this case, dead burned trees) in the maintenance of biodiversity and ecosystem processes (Lindenmeyer, Burton, and Franklin, 2008).  Those burned trees are hard at work shepherding the forest back to life, not wasted timber that must be "salvaged".