Monday, October 31, 2022

Fire Retardant Visible From Space

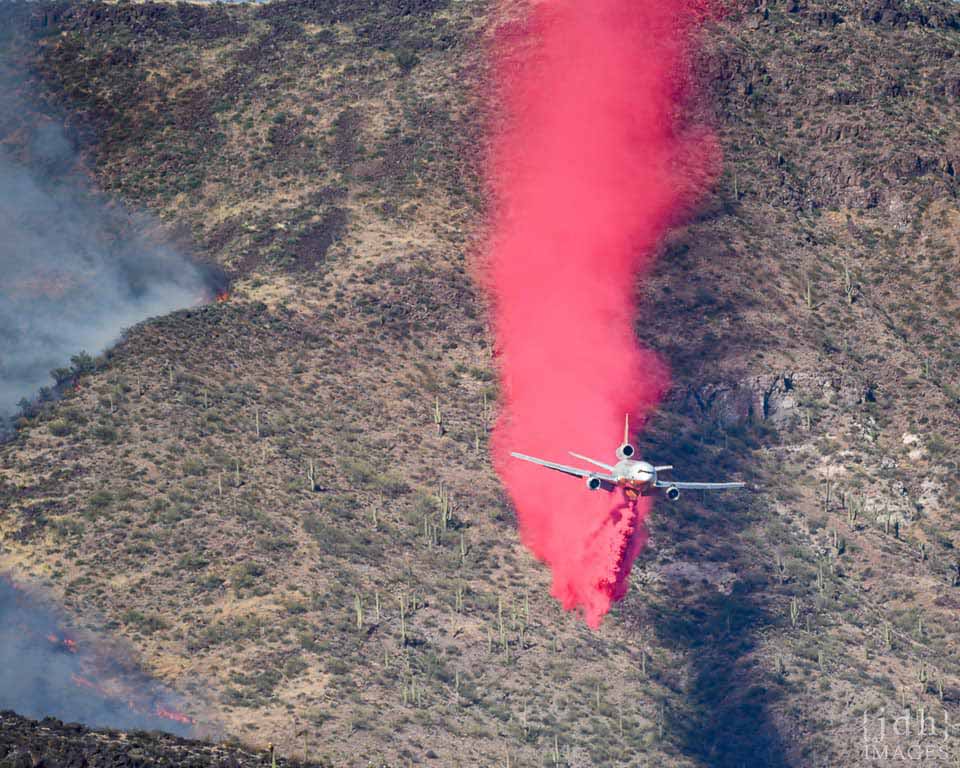
The Bush Fire started on the West side of Highway 87 in Arizona on June 13, 2020.  Drive by strong winds from the SW, it soon spread to the highway median and then crossed to the East side of the highway.  From there, it went on to burn 193,000 acres until it was completely contained on July 6, 2020.
Air tanker drops retardant ahead of fire.  Photo by JDH images.  https://wildfiretoday.com/tag/bush-fire-in-arizona/

Air tankers were extensively used in the initial attack on the fire, and Google Earth images of the fire start location show some interesting features.  These images were taken on June 20, 2020, 7 days after the fire had burned this location.

The fire started on the West side of 87.  Fire retardant strips are visible in several locations.

Where the fire was backing against the SW wind, retardant drops were successful in stopping the spread of the fire.  A small bulge near the top of the image shows where fire crossed the line, but was contained.

Retardant drops on the south side of the fire were not successful in stopping the fire, but may have been instrumental in slowing the fire which allowed it to be stopped at the dirt road.

Retardant drops directly in front of the wind-driven fire were not successful in holding against the onrushing flames.  The fire spread over and around the retardant line in this image.

At another location on the same date, the fire can still be seen actively burning.


Thursday, October 27, 2022

Is Forest Thinning Beneficial for Everyone?

 This Undark article says Pinyon jays are proposed for ESA listing because of forest restoration thinning:

“some bird biologists... are sounding the alarm that even today’s thinning methods degrade pinyon jay habitat. These woodlands are already under extreme drought stress, especially in New Mexico, with predictions for widespread loss due to climate change. And some studies suggest thinned piƱon-juniper forests are less resilient to beetle infestation and drought.


 I participated in a 10-year monitoring study of thinned and unthinned Pinyon-Juniper woodlands in the Manzano mountains.  Our findings were different from those discussed in the study; we found increased soil moisture at thinned plots, which led to richer pinyon nut crops and an increase in pinyon jays.  


However, I'm not arguing that the cited studies are wrong; there may be important site-specific differences between different restoration treatments in different areas.    Some restoration can actually help pinyon jays, we just need to figure out which treatments, and how!

Hopefully, we can all agree that if a treatment isn't making things better for native plants and animals we need to rethink it; just because something is called "restoration" doesn't mean its automatically good.  That's why we need science like this.

Citation.

Wednesday, October 26, 2022

Upcoming Endangered Species Listing Decisions in Arizona 2022-2027

I found a 5-year workplan on the USFWS site and made a list of all of the AZ species that USFWS will make listing determinations for. 

Its pretty interesting to look at what’s coming up.  Lots of talussnails!  But after the Sonoran desert tortoise (which they decided not to list), I think the next big one is the Monarch butterfly.  

Also interesting that there’s no bumble bee species on this list, as I know they’ve been petitioned.  Of course, this could all change as new species are added to the candidate list and priorities change...


FY22

Sonoran desert tortoise

-widely distributed in AZ deserts

- listing decision spring 2022: not warranted


Cactus ferrugous pygmy owl 

-by end of calendar year

https://www.inaturalist.org/taxa/237012-Glaucidium-brasilianum-cactorum

https://www.audubon.org/news/this-tiny-desert-raptor-could-soon-regain-federal-protection


roundtail chub


gray wolf (western populations)


FY23

Joshua tree 


Quitobaquito tryonia


FY24

Monarch butterfly

-widely distributed in AZ

A listing proposal is anticipated by November 2023, with a final listing decision by end of Federal FY2024 (September 2024). 


Las Vegas bearpoppy Arctomecon californica


Pinaleno talussnail Sonorella grahamensis

San Xavier talussnail Sonorella eremita


FY25

Ferris's copper butterfly Lycaena ferrisi

https://www.inaturalist.org/taxa/1360320-Tharsalea-rubidus-ferrisi

ASNF southwest of Springerville


Chisos coral-root Hexalectris revoluta

Sky island mountains


Threecorner milkvetch  Astragalus geyeri var. triquetrus


Grand Wash springsnail Pyrgulopsis bacchus

Kingman springsnail Pyrgulopsis conica


FY26

Arizona toad Bufo microscaphus microscaphus

- widely distributed in AZ

https://www.inaturalist.org/taxa/64982-Anaxyrus-microscaphus


Navajo bladderpod Lesquerella navajoensis

- habitat on Navajo Nation


Yuman Desert fringe-toed lizard Uma rufopunctata


Mojave poppy bee    Perdita meconis 


Bylas springsnail Pyrgulopsis arizonae

Gila tryonia Tryonia gilae

Huachuca woodlandsnail Ashmunella levettei


Squaw Park talussnail Maricopella allynsmithi

-populations are on city or county parks in the Phoenix metro area https://explorer.natureserve.org/Taxon/ELEMENT_GLOBAL.2.114155/Maricopella_allynsmithi


Verde Rim springsnail Pyrgulopsis glandulosa

https://www.inaturalist.org/taxa/111425-Pyrgulopsis-glandulosa


FY27

Morton's wild buckwheat  Eriogonum mortonianum


Pipe Springs cryptantha    Cryptantha semiglabra


Source: https://www.fws.gov/media/national-listing-workplan-fiscal-years-2022-2027

More USFWS lists:  https://ecos.fws.gov/ecp/species-reports
Friday, October 14, 2022

Biodiversity on Prescott National Forest

 How many plant species are there in a geographic area?  Previously, I used iNaturalist to calculate total biodiversity for selected areas.  But this method is just a snapshot of the species currently recorded in iNaturalist.  In some areas, people may have already observed most of the biodiversity, while in other areas there may still be much more to discover.

One way to estimate the total unobserved biodiversity of a geographic area is to look at the timeline of species observations.  If more new species are being observed each year, there are likely still many more species to discover, whereas if the number of new species each year is declining, we may be able to fit a decay function that would predict the total number of species that will ever be observed.

iNaturalist offers a couple of ways to find lists of new species.  As an example, I will use the Prescott National Forest in AZ.

The first method: the API function recent_taxa.

According to this method, there have been 57* new plant species observed on the Prescott National Forest in iNat so far this year.  This is filtered for only research grade observations (quality_grade=research).  There are a lot of new observations by experts that just haven’t been confirmed by other experts. *For some reason this returns the species, genus, and family so to get 57 I subtracted repeated taxa (29) from total new taxa this year (86).

https://jumear.github.io/stirfry/iNatAPIv1_identifications_recent_taxa.html?place_id=130970&taxon_id=47126&hrank=species&order=desc&order_by=created_at&per_page=200&quality_grade=research

The URL code is pretty easy to modify for other places (PNF = 130970) and other taxa (plants = 47126).  Here is more background on API query terms: https://api.inaturalist.org/v1/docs/#!/Identifications/get_identifications_recent_taxa


The second method: download data.

 When searching observations for Prescott National Forest and filtering by plants, iNaturalist returns a page with summary statistics.   This can be downloaded and analyzed in Excel.

https://www.inaturalist.org/observations?place_id=130970&iconic_taxa=Plantae 

 After downloading the data:

1. sort the table from oldest to newest by the observation date column

2. select the whole table

3. use “remove duplicates”, and look for duplicates in only the species name column

The resulting list will show you the first observation of each species.  I then summarized the list by year and created this graph showing the year and number of new plant species recorded in iNaturalist for PNF.  


This method also sometimes returns other taxa than species, so the totals don't quite match between the website, the API, and this method.  Also, this graph is not filtered for only Research Grade observations, but it would look basically the same.  The graph appears to increase over time as more people use iNaturalist to record plant species on Prescott National Forest, up to a peak year in 2020.  Since then the number of new species seems to fall off, although it should be noted that 2021 was a drought year and 2022 isn't over yet.  


Wednesday, October 05, 2022

Biodiversity Phenology

 There are many ways to explore biodiversity using iNaturalist.  One way to study the biodiversity of a geographic area is with phenology:  the science of when things happen.


For example, it is possible to modify the search URL to find observations of plants within 100 km of Dublin, OH, to search for specific months.  The count of observations for each species give some idea of their abundance in that month.


Central Ohio's most common flowering plants in March.

Central Ohio's most common flowering plants in April.

It is interesting to note that the number of observations for e.g. Bloodroot (Sanguinaria canadensis) increase from March to April, but its relative abundance appears to decrease as Dutchman's Breeches (Dicentra cucullaria), Trout Lilies (Erythronium americanum) and other species are photographed much more in April.