Showing posts with label new mexico. Show all posts

Tuesday, September 05, 2023

How Advocates Stopped Aerial Insecticide Spray in NM

APHIS (a U.S. Government agency) routinely broadcasts insecticides across millions of acres of the Western U.S., in an attempt to control populations of grasshoppers.  Climate change (warmer winters, drier summers) has led to an increase of grasshoppers over the last decade, and APHIS has tried to keep pace.  https://acis.cals.arizona.edu/community-ipm/home-and-school-ipm-newsletters/ipm-newsletter-view/ipm-newsletters/2023/06/07/grasshoppers

Unfortunately, broad-scape application of pesticides harms numerous other animals (and people).  

A recent attempt to use airplanes to spray pesticides over the Rio Chama watershed in New Mexico was protested and eventually cancelled: https://www.xerces.org/blog/how-advocates-stopped-aerial-insecticide-spray-on-25000-acres-of-new-mexico-natural-areas

More Info:

Overview of Program:  https://www.aphis.usda.gov/aphis/ourfocus/planthealth/plant-pest-and-disease-programs/pests-and-diseases/grasshopper-mormon-cricket/CT_Grasshopper_Mormon_Cricket

"Environmental Documents" opens a page with state-specific and site-specific Environmental Assessments.  This provides more info about areas in each state that have been treated.

In general, areas that show in red on aerial surveys will be treated in the following year. 

From:  https://www.aphis.usda.gov/plant_health/plant_pest_info/grasshopper/downloads/hazard.pdf

Annual grasshopper density surveys:  https://www.ars.usda.gov/plains-area/sidney-mt/northern-plains-agricultural-research-laboratory/pest-management-research/pmru-docs/grasshoppers-their-biology-identification-and-management/outbreak-and-survey-info/outbreak-and-survey-info/

APHIS has a large number of pest species with control programs: https://www.aphis.usda.gov/aphis/ourfocus/planthealth/plant-pest-and-disease-programs/ea


Thursday, October 27, 2022

Is Forest Thinning Beneficial for Everyone?

 This Undark article says Pinyon jays are proposed for ESA listing because of forest restoration thinning:

“some bird biologists... are sounding the alarm that even today’s thinning methods degrade pinyon jay habitat. These woodlands are already under extreme drought stress, especially in New Mexico, with predictions for widespread loss due to climate change. And some studies suggest thinned piƱon-juniper forests are less resilient to beetle infestation and drought.


 I participated in a 10-year monitoring study of thinned and unthinned Pinyon-Juniper woodlands in the Manzano mountains.  Our findings were different from those discussed in the study; we found increased soil moisture at thinned plots, which led to richer pinyon nut crops and an increase in pinyon jays.  


However, I'm not arguing that the cited studies are wrong; there may be important site-specific differences between different restoration treatments in different areas.    Some restoration can actually help pinyon jays, we just need to figure out which treatments, and how!

Hopefully, we can all agree that if a treatment isn't making things better for native plants and animals we need to rethink it; just because something is called "restoration" doesn't mean its automatically good.  That's why we need science like this.

Citation.

Monday, September 12, 2022

Thistle Misidentification

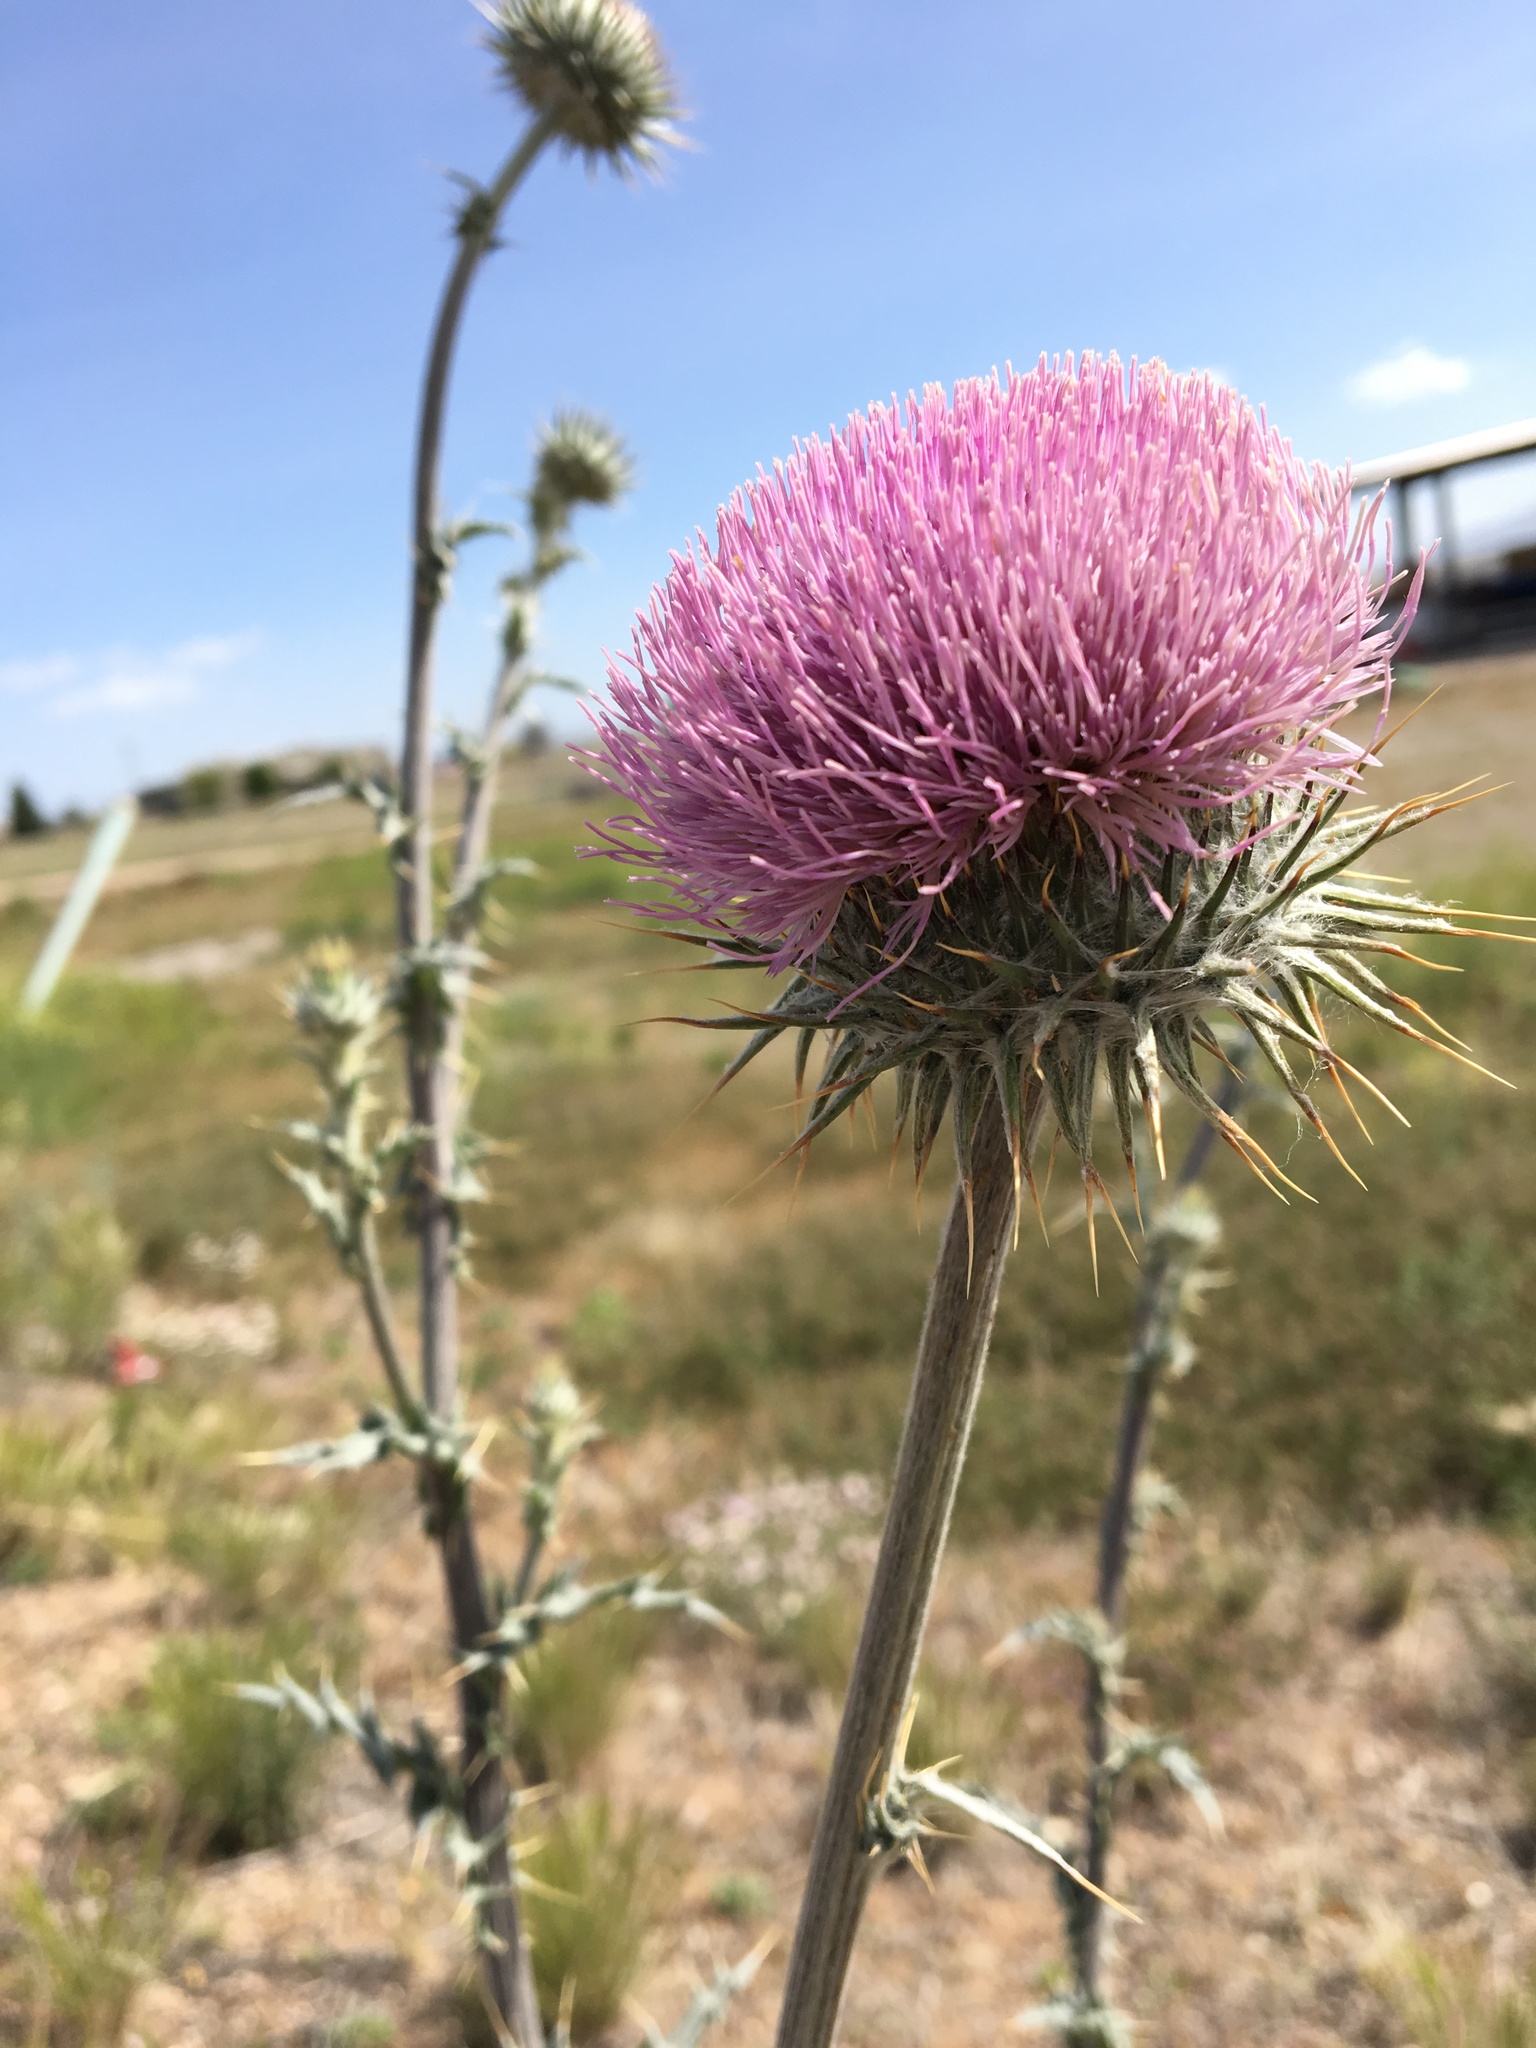
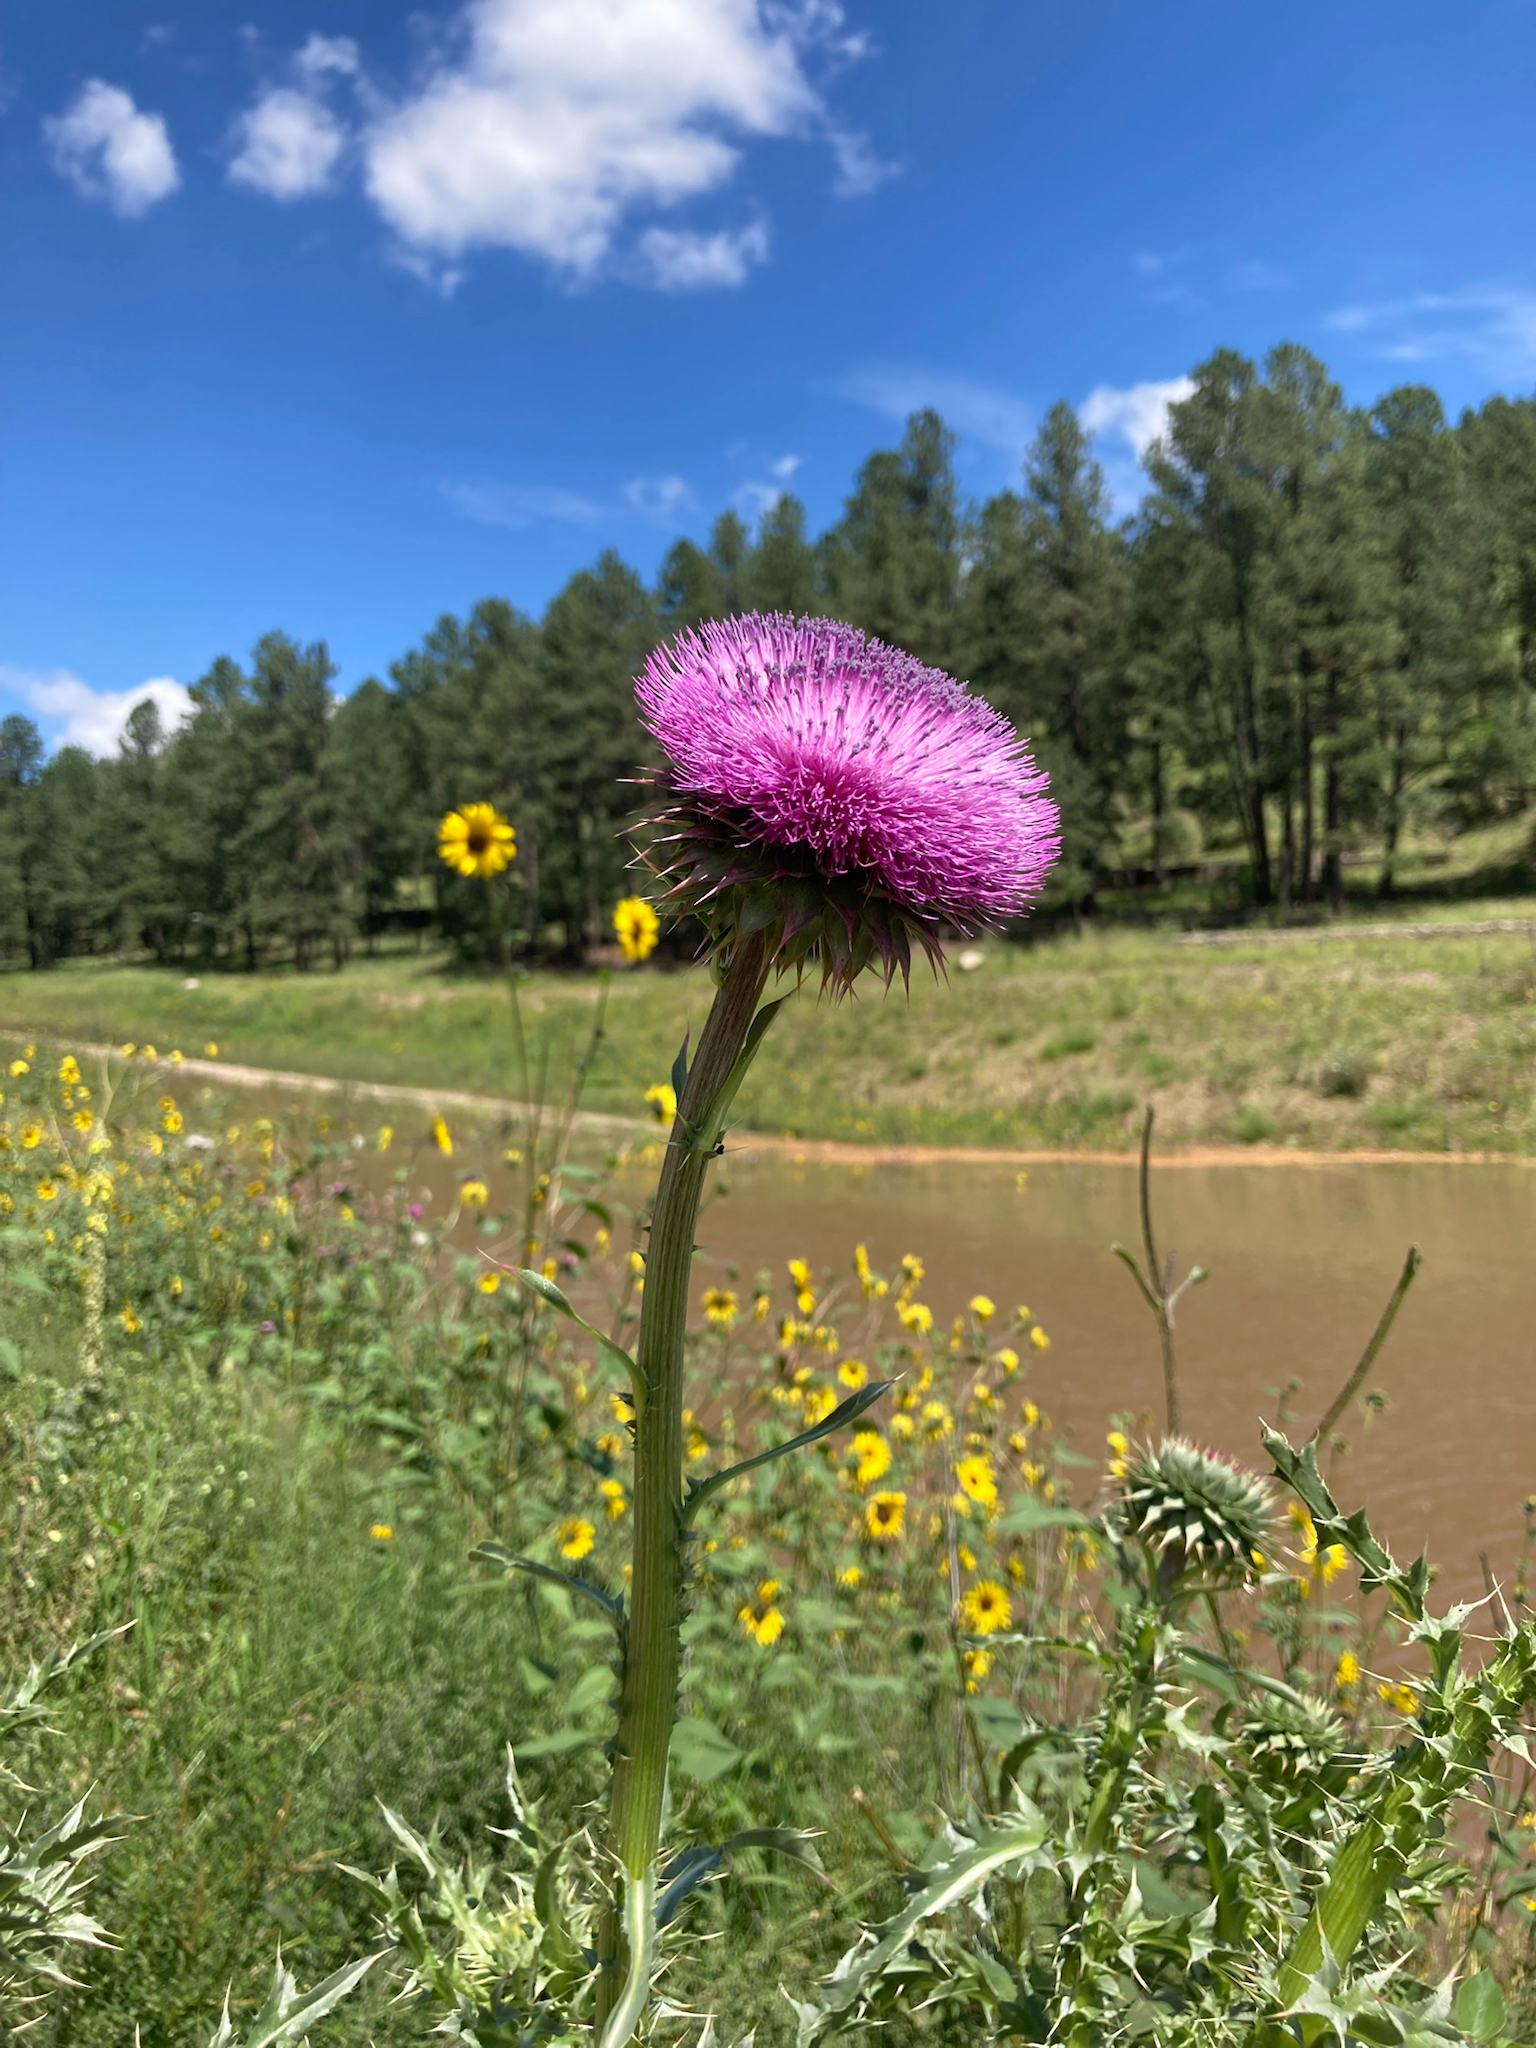
Thistles are amazing flowers, but there are both native and nonnative invasive species in the Western US.  Some people who try to do good by removing nonnative thistles accidentally kill the native species as well. 

NM Thistle, Cirsium neomexicanum. My photo on iNaturalist. Link: https://www.inaturalist.org/observations/15024423

I worked with an AmeriCorps crew in the Sacramento Mountains (Lincoln NF) that had been removing musk thistles.  But I found out they didn’t know how to tell the difference between native and invasive thistles. 

Photo of musk thistle Carduus nutans from iNaturalist user c-guinan. Link: https://www.inaturalist.org/observations/132367683

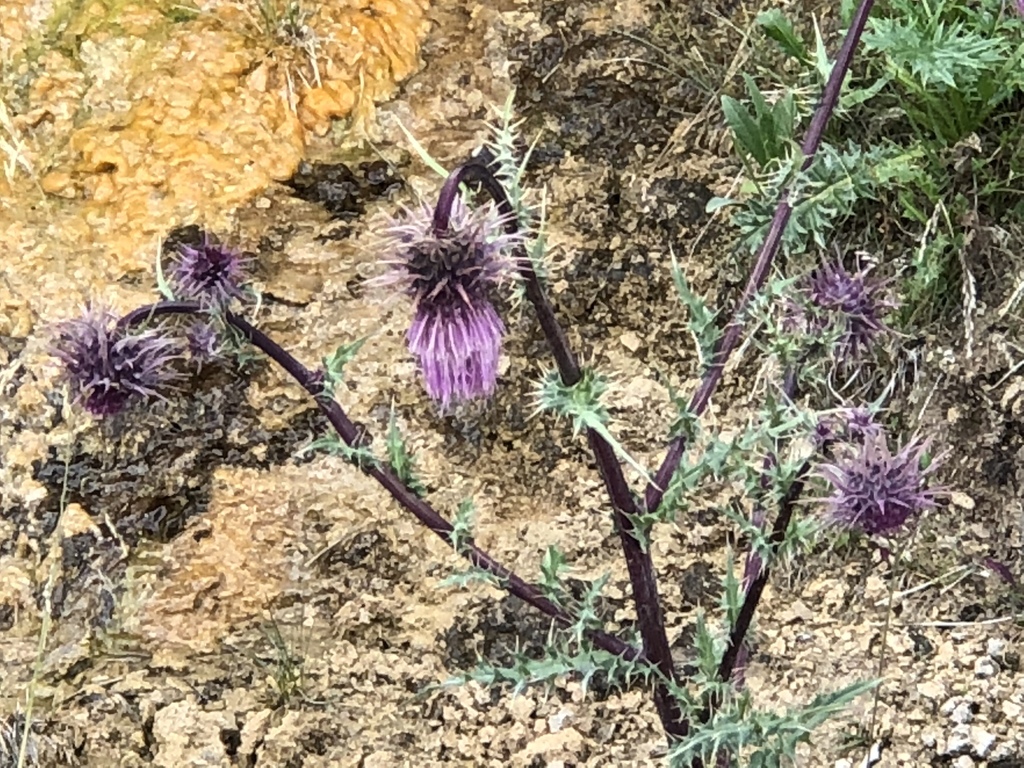
Even worse, they didn’t even know that there is an Endangered species of native thistle in those mountains!  We investigated and it looks like they at least didn’t kill any endangered thistles, but it could have been really bad. 


Photo of Endangered Sacremento Mountains Thistle Cirsium vinaceum from iNaturalist user ck2az.  Link: https://www.inaturalist.org/observations/14433149

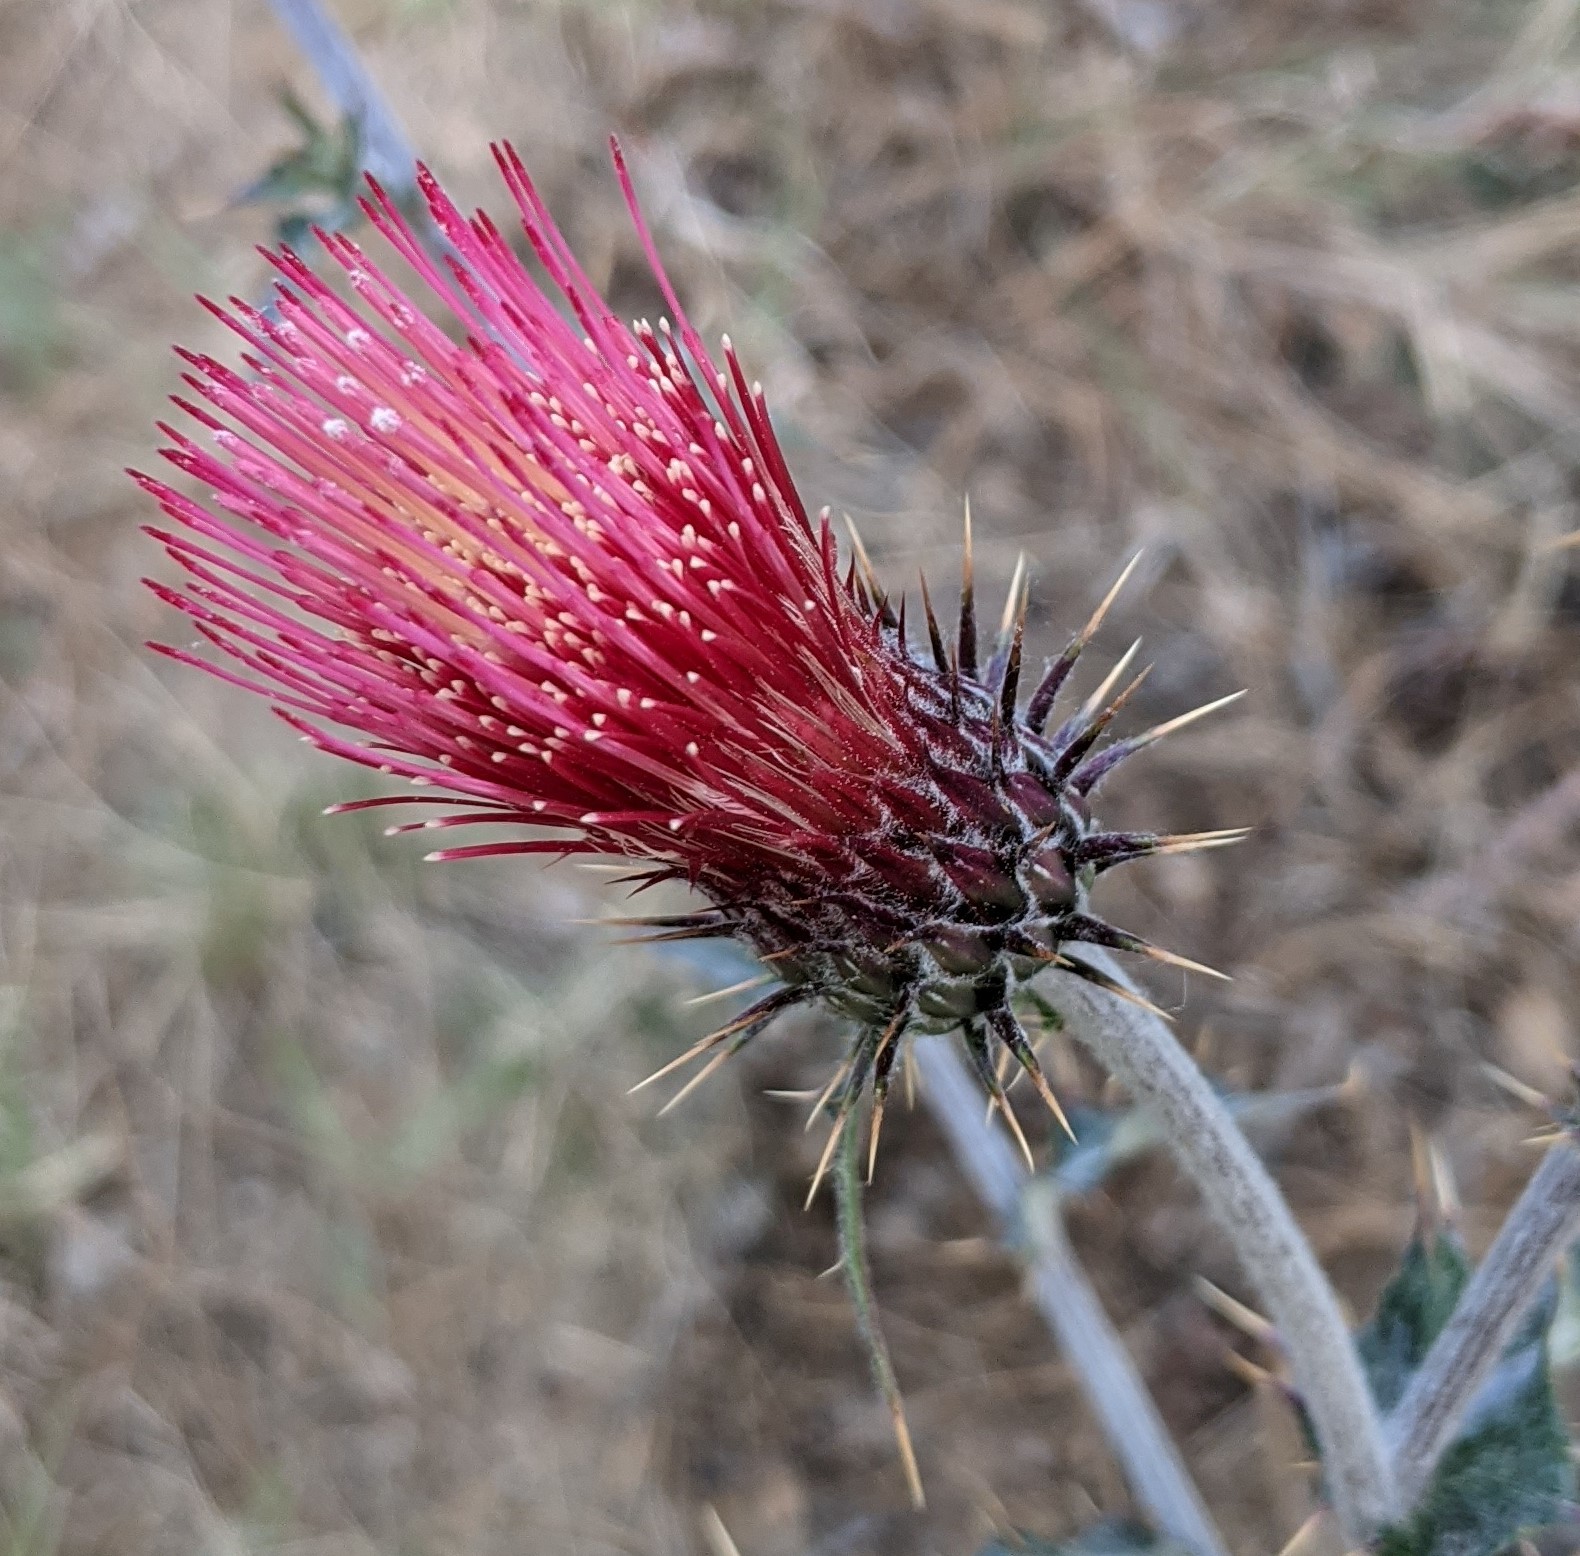
I’m currently trying to find the volunteers on the Prescott national forest who are pulling up all of the Arizona thistle along popular trails.  Its especially troubling to me when people who are trying to do good by removing invasive species end up destroying native species.

Arizona Thistle Cirsium arizonicum.  My photo on iNaturalist.  Link:  https://www.inaturalist.org/observations/87880049

Everyone who’s done natural resource work has stories of project missteps.  I don’t know how to prevent all mishaps, but talking about these misidentifications is a good first step.

The NM Native Plant Society has a great Thistle ID book written by Bob Sivinski.

Wednesday, September 28, 2016

Albuquerque 2016 Monsoon Season

From the ABQ NWS Homepage.
The monsoon began early in Albuquerque this year, with a week of good moisture at the end of June. But then June high pressure returned and most of July was hot and dry.  It wasn't until the beginning of June that the rains reliably returned.  Overall, the monsoon wasn't bad, but the hiccup in the beginning ended up dooming most annual plants.  Only perennials managed to reap the rewards of the late-breaking monsoon moisture.  Now, at the end of September, many monsoonal plants are still trying to finish flowering and set seed.  Many plant species are flowering late and show signs of stunted growth.

Tuesday, April 05, 2016

Portable Real-Time Measurement of Air Quality

I recently purchased a Uni-Trend Air Quality Meter.

It measures VOCs (both natural and man-made), PM2.5, and temperature and humidity.

Coarse particles (PM10) have a diameter of between 10 micrometers and 2.5 micrometers and settle relatively quickly whereas fine (PM2.5) (0.1 to 2.5 micrometers in diameter) particles remain in suspension for longer. To put things into perspective, human hair has a diameter of 50-70 micrometers and a grain of sand has a diameter of 90 micrometers.


Sources of fine particles include all types of combustion activities (motor vehicles, power plants, wood burning, etc.) and certain industrial processes.  Sources of coarse particles include crushing or grinding operations, and dust from paved or unpaved roads.


PM2.5 is made up of sulfates, nitrates, carbon, and soil.


Albuquerque reports the Air Quality Index for daily pollen and Fine/Coarse Particulates:


 But these numbers are reported as "Index" values, and have to be converted to ug/m3 to compare to measured values:


Over the last week, Albuquerque has reported AQI for PM2.5 of almost 50, which should be about 15 micrograms per square meter, whereas my unit typically reports 30-50 micrograms per square meter, indoors and outdoors.  It is possible that ABQ measures air quality higher from the ground than my unit, or that PM2.5 is lower during the night when I don't check it.

Here is an excellent resource for more information.  Most of the graphics on this page are from this source.

Wednesday, February 24, 2016

Wildlife Camera Photos - Winter 2015-2016

These photos were taken by a network of motion-triggered wildlife cameras in the Manzano Mountains, New Mexico:

Bobcat

Snow

Turkey
Coyote

Wednesday, January 06, 2016

Welcome to the High Desert of New Mexico, USA


Surviving in the High Desert of New Mexico is like visiting another planet.

I suggest you find a house with a good airlock and sunshade, but you won't be able to filter out the cosmic rays; living up here is like being an airline stewardess.

The desert has a way of simplifying human needs: water, oxygen, respect (for the sun), oh, and more water.

The most important thing is water. You have to drink all the time. When you wake up in the morning you must drink a full nalgene; you've lost at least that much through exhalation during the night. I suggest miso bone broth soup to replace the electrolytes as well. Its dry here and you can't always tell when you're sweating because evaporation is so efficient.

Sometimes you can't drink enough water. The answer is coconut water. Always keep some at hand in case of emergencies.

High altitude. One of the commonest complaints (after dehydration, always check that first) is low oxygen. People forget to breathe. You have to really move that diaphragm! Ginseng and other tonifying herbs might help, too. Oh, and bone broth soup. Think like a sherpa.

Sun. I used to go without sunblock, but we're too close to the sun here. Respect the sun. Always wear sunblock when you have exposed skin - or wear a burkha. UV-blocking sunglasses are also, sadly, necessary. I hate wearing glasses, but if you don't the Light will wash away your world. Yes, it is possible to sunburn the back of your eyes.  8-(

Moisturizer. Dry skin is serious. One secret to prevent over-drying is to always end showers with cold water; it tones the muscles and closes pores in the skin so you don't lose all your hard-earned moisture. Never, ever use drying soap. I don't think that should be a problem, but I'm warning you now: Don't let cracks form on your hands or it will be Too Late, and you'll be covered in bandages like a mummy.

 Welcome to New Mexico!

Friday, December 18, 2015

2015 New Mexico Weather Recap

The ABQ NWS office has an excellent recap of the state's weather over 2015.  For example, here is their summary of the summer monsoon:

The 2015 monsoon season got off to a quick start with heavy rainfall, floods, flash floods and severe weather in mid and late June, as well as the first two weeks of July.  A relatively quiet period ensued for most of the remainder of July. A resurgence of heavy rain returned from very late July through early August.  An outbreak of severe weather was the dominate weather story in mid August, and to a lesser extent on September 9th and 23rd. 
products issued during monsoon season
By the numbers:  The Albuquerque NWS office issued 53 flash flood warnings between June 15 and September 30. 

The biggest news of the year was probably the good precipitation that finally ended the drought that began in early 2011:

Drought conditions developed across New Mexico in early 2011, with few breaks in the drought through 2012, such that much of the state was gripped in the worst drought episode since the 1950s.  Near normal statewide precipitation in 2013 and 2014 did little to improve the drought.  Much of the precipitation in 2013 and 2014 fell during the monsoon season, rather than the much more needed winter mountain snowpack.
Finally, New Mexico precipitation in 2015 was above normal for much of the year, and the period January through November was the fifth wettest on record since 1895.  As shown in the graph to the right, precipitation in New Mexico was well above average in January, May, July and October, with only two months below average - August and September.  These wetter than normal conditions supported a steady reduction in the intensity and coverage of the short term drought.  Finally, in early December 2015 New Mexico was drought free!  The last time the state was without any drought status was the week of November 23, 2010!
By the numbers:  New Mexico went 263 weeks with a portion of the state in moderate or worse drought!
NM monthly precipitation for 2015
  
 percent of new mexico in drought since 2011
 Source: U.S. Drought Monitor

Tuesday, October 13, 2015

Analysis of Soil and Vegetation Maps:  Accuracy and Utility for Describing Actual Habitats


There are four sources of landscape information from maps at the project level a few miles on a side.  Topogaphic maps, satellite maps, soil service maps, and vegetation maps.   
Comparing soil and vegetation maps at this scale is complicated by inaccuracies of both map sources and the strange ambiguity of aerial photography.  Soil was mapped by NRCS into 6 major soils.  However, two of the soils are described as compound soils, regions of undefined patches possibly intergrading continuously into one another.  For example, Pyote-Maljamar soils (PU on soil map) have a layer of fine sand everywhere, but there are unmapped bits and pieces of caliche at around 50 inches (Maljamar soils) in a matrix of deep sand (Pyote soils).

Soil map created using the NRCS Web Soil Survey showing major soil types.  PT and PU are deep sands, BH and KO are shallower silty soils, and TF is intermediate.  (PA and BA are extensions of PT and TF, respectively, in Eddy county.)


Soil Profiles:

PT
PU
TF
BH
KO
 Soil Name
Pyote
Pyote
Maljamar
Tunuco
Berino
Cacique
Kimbrough
0-10
A: Loamy fine sand
A: fine sand
A: fine sand
A: loamy fine sand
A: fine sand
A: fine sand
A: gravelly loam
10-20
AC: loamy fine sand
Btk: sandy clay loam
Bt: sandy clay loam
Bkm: cemented material
20-30
Bkm: cemented material

30-40
Bt: Fine sandy loam
Bt: fine sandy loam

Bt: sandy clay loam

Bkm: cemented material
40-50

50-60
Bkm: cemented material
Type 
Sandy eolian deposits
Sandy eolian deposits over sandy calcaereous alluvium
Calcaerous eolian deposits
Calcaerous alluvium and/or eolian deposits

Selected Soil Properties

PT
PU
TF
BH
KO
Depth to restrictive layer
>200cm
127cm
43cm
>200cm
15cm
Calcium Carbonate (CaCO3)%
2%
2%
0%
17%
15%
% sand
75.8%
81.9%
78.6%
62.6%
43.0%
Ksat (inches/hour)
7.8
8.5
12.6
1.7
0.5

In this part of NM, depth to a restrictive soil layer indicates the presence of caliche near the surface.  These petrocalcic horizons are denoted Bkm on the soil profile.  KO has the shallowest effective soil, followed by TF.  Some parts of BH appear quite shallow, but in the table the depth to a restrictive layer is listed as greater than 200cm, possibly because some of the soil (i.e. the Berino component) lacks a caliche layer. Caliche is composed of calcium carbonate, so BH and KO are listed with the most calcium, and the least sand in their profile. 

Saturated hydraulic conductivity (Ksat) refers to the ease with which pores in a saturated soil transmit water. The estimates are expressed in inches/hour for ease of comparison to possible rainfall rates. They are based on soil characteristics observed in the field, particularly structure, porosity, and texture.

Restrictive soil layers and overall soil texture contribute to the ability of a soil to drain water.  PT, PU, and TF are listed as very well drained soils because they can all drain more than 7 inches of rain an hour, whereas BH and KO are significantly less porous, draining only 1.7 and 0.5 inches of rain an hour, respectively.  Most of the water from heavy rains probably runs off of these soil types, limiting the amount available to grow plants. 

Saturated hydraulic conductivity is considered in the design of soil drainage systems and septic tank absorption fields. It probably has the greatest impact on plant production of any soil parameter in SE NM.

Hydraulic conductivity is the rate at which a soil can absorb water.  Red areas have the least ability to absorb rainfall, while blue areas have the greatest ability to absorb rainfall. Map created using NRCS Web Soil Survey.  

Vegetation Map
Vegetation map from USGS GAP Vegetation Mapper uses NatureServe Ecological System Classification.

Vegetation Map Key and Attributes

Table 3. Vegetation Map Key and Attributes
Color
ReGAP Community Name
Vegetation Type
Dominant Species
Accuracy

Great Plains Shortgrass Prairie
Grassland
Biennial wormwood, Russian thistle
Low – should be mapped as disturbed area

Mesquite Upland
Thornscrub
Mesquite, Catclaw Acacia, Mimosa, Yucca
High - mesquite dominant

Sandhill Shrubland
Shrub
Shinnery oak, Catclaw acacia, Giant dropseed
Medium – not all dune
N/A
Sandy Plains Semi-Desert Grassland
Grassland
Purple three-awn, Sand dropseed, Sand muhly
Low – not mapped

The GAP national land cover data, based on the NatureServe Ecological Systems Classification, are the foundation of the most detailed, consistent map of vegetative associations available for the United States.  The soil map is interpolated based on soil pits and vegetation patterns, so in a way it functions as a hand-drawn vegetation map.  Vegetation patterns have changed from the time the soil survey was completed (1960’s?) to now.  This GAP high-resolution vegetation map was produced via satellite mapping and computer algorithms. 

The prairies of the southern Great Plains are also called the Llano Estacado, a region where vast flat to rolling uplands are covered with blue grama grass.  However, this vegetation type is misclassified.  GAP maps roads and disturbed areas with low grass as shortgrass prairie (brown on image) because these areas look similar to prairie in multispectral satellite imagery.  It maps the rest of the project area as a fractal pattern of mesquite upland (mauve) patches and sandhill shrubland (green) patches. 

Mesquite has spread throughout areas with deep sandy soils and now forms the default vegetation community across much of the area. Mesquite can also invade sandhills and desert washes and other coarse-textured soil areas. It is especially invasive in grasslands such as Sandy Plains Semi-Desert Grasslands, Great Plains Shortgrass Prairie, and Chihuahan Semi-Desert Grasslands. 

Mesquite grows best when soils are deep, lacking the caliche or clay pan that would limit infiltration and storage of winter precipitation in deeper soils layers. Mesquite and other deep-rooted shrubs exploit the deep soil moisture that is unavailable to cacti or grasses. 

The effects of major soil boundaries are evident: deep sand (PT and PU) soils support more sandhill shrubland, whereas soils with shallow restrictive horizons (BH and KO) tend to have more mesquite upland patches.  The vegetation map fails to identify patches of Lehman lovegrass grasslands, or catclaw acacia shrublands, but it does correctly identify shinnery oak areas as sandhill shrubland. 

However, the map misses out on an important intermediate community, sandy plains semi-desert grassland.  Sandy plains grasslands are actually the dominant community throughout much of the project area.  It is distinguishable on the ground by the greater proportion of grass than shrubs on sandy soils, often with Aristida purpurea, Muhlenbergia arenicola, and especially Sporobolus flexuousus.  However, this community has been invaded by mesquite shrubs (some areas of which have been recently killed with herbicides) so these grassland patches can be difficult to distinguish from true shrublands.

Topo Map

A topo map shows that areas with accumulating sand are typically uplands, especially breaks in slope where winds drop eolian deposits.  Eroding, exposed slopes reveal deeper, more-developed paleosoils, possibly Pleistocene clays (Steve Hall, 2006 Geomorphology of Mescalero Sand Dunes).  

On top of soil and geomorphic landscape-determined vegetation patterns, local populations of invasive species have overlaid an unpredictable pattern of monocultures of Lehman Lovegrass, Artemisia biennis, and occasional plants of Salsola tragus around wellpads.  Note that none of these invasive species are NM state-listed noxious weeds.  There are also surprising areas of intact, diverse Chihuahuan grasslands with healthy stands of black grama , muhly arenicola, and sporobolus cryptandrus.  All of the sand dunes here, despite presence of shinnery oak, and even some Artemisia filifolia, are coppice or hummock dunes that formed around shrubs during historical time (Hall, 2006). 

 Conclusion

Unfortunately, there are no map sources of reliable data on habitats and vegetation communities at field- or project area-scale.  Each source provides valuable clues along with misleading simplifications, errors, and obfuscations of actual on-the-ground conditions. 

Appendix: Soil Properties Maps

Depth to a restrictive soil layer:

Percent sand:

Percent calcium carbonate:


Friday, October 02, 2015

2015 Summer Monsoon Totals


The NWS maintains a report of monsoon totals for the ABQ metro area.
Percent of normal monsoon moisture received in July, August, and September 2015.

Moisture during the summer was spotty, but usually above average.

Monday, August 24, 2015

Smoke from WA Wildfires Reaches Albuquerque, New Mexico.

The smoke from large wildfires burning in NE Washington, N Idaho, and N. Montana reached as far as Albuquerque, New Mexico on Sunday morning.

The smoke covers a large part of the Western U.S.

Cliff Mass has excellent reporting on the smoke from the WA wildfires.

Airquality.weather.gov has the best air pollution monitoring data.  The AIRPACT website has high-resolution models of smoke production and transport in the PNW.

U.S. Wildfire Activity Map.  From ESRI.

Wednesday, June 10, 2015

El Nino in the Spring

March, April, May and the first week of June have been quite wet for the East slopes of the Rockies and the Western Great Plains, with large regions receiving more than three or four times normal precipitation.  Meanwhile, the West has continued its drought, with CA looking especially dry.
NM has significant regions above 400% of normal precipitation.  While there is lush growth in some areas, other areas are not appreciably greener than they might otherwise be.  Sometimes this can be attributed phenology (e.g. to summer grasses not responding to early spring rains, or perhaps the exact timing is important for annual germination), but some must also be due to the severe productivity reduction of overgrazed and eroded soils.

El Nino has strengthened in recent months.  An active fall hurricane season supplyied NM with abundant moisture in the fall, In the winter a steady progression of Pacific storms brought an average amount of precipitation.  And since late May we have already experienced large moisture plumes from yet more unusually-strong Eastern Pacific hurricanes,  Andres and now, currently, Blanca.