Showing posts with label information. Show all posts

Saturday, January 31, 2026

DNA Barcodes, Klee Diagrams, and the Secrets of Speciation

Modern biodiversity detectives have found new ways to synthesize massive amounts of sequence data into clear information and insights. Two powerful tools to help visualize and understand the structure of life are DNA barcodes and Klee diagrams. Mark Stoeckle and David Thaler pioneered the use and explanation of these tools to offer insights into how species originated and evolved.

What is a DNA Barcode?

A DNA barcode is a short, standardized segment of the genome used for species identification. In the animal kingdom, the gold standard is a 648-base pair (bp) segment of the mitochondrial cytochrome c oxidase subunit I (COI) gene. While this segment represents less than one-millionth of an organism’s total genome, it has proven remarkably effective because mitochondrial DNA clusters largely overlap with species as defined by experts.

This tool is commonly used in eDNA samples to identify species from the environment. The BOLD (Barcode Of Life Database) now contains approximately five million of these barcodes, covering about 100,000 animal species. Interestingly, there is nothing inherently “special” about the COI gene biologically; it became the standard because reliable primers were adopted by a critical mass of the scientific community.

Visualizing Life: The Klee Diagram

To make sense of these millions of sequences, scientists developed the Klee diagram, a heat map that displays correlations between DNA sequences. In these diagrams, every sequence is compared with every other sequence, and the intersections are color-coded to show similarity. (Sirovich, Lawrence, Mark Y. Stoeckle, and Yu Zhang. “Structural analysis of biodiversity.” PLoS One 5.2 (2010))
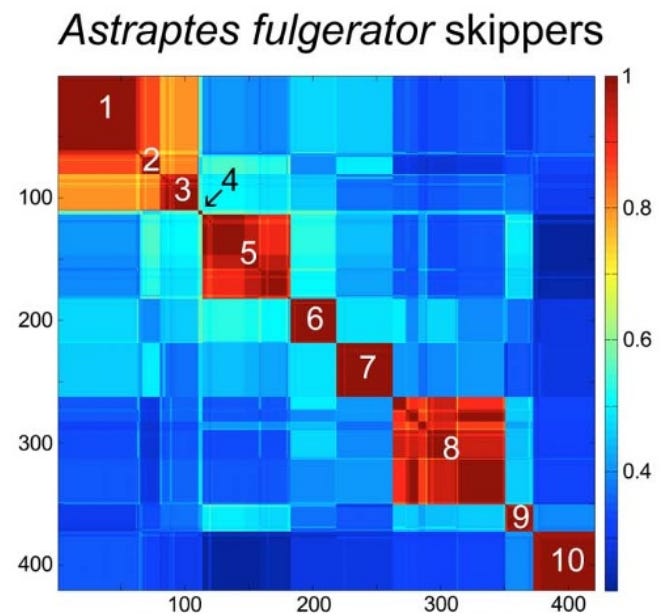
Species-level clusters in skipper butterfly Astraptes fulgerator COI barcode Klee diagram. Sequence clusters appear as blocks of high correlation along the diagonal and correspond to the 10 provisional species (1. INGCUP, 2. HIHAMP, 3. FABOV, 4. BYTTNER, 5. YESENN, 6. LONCHO, 7. LOHAMP, 8. SENNOV, 9. CELT, 10. TRIGO). Block sizes reflect number of sequences per species (n 3–88). Stoeckle and Coffran 2013.

Key features of Klee diagrams include:

• Indicator Vectors: Each DNA sample is listed on both the x and y axis and a heat map is generated comparing each species to itself (red=1, a perfect match) and all of the other samples in the database.

• Species Islands: When sequences are arrayed, species appear as sharp, non-overlapping squares. This visualization confirms that species are “islands in sequence space,” with distinct clusters and empty gaps between them.

• Scalability: Recent software developments like PyKleeBarcode allow these diagrams to be computed for very large datasets, potentially representing the whole animal kingdom in a single information space.
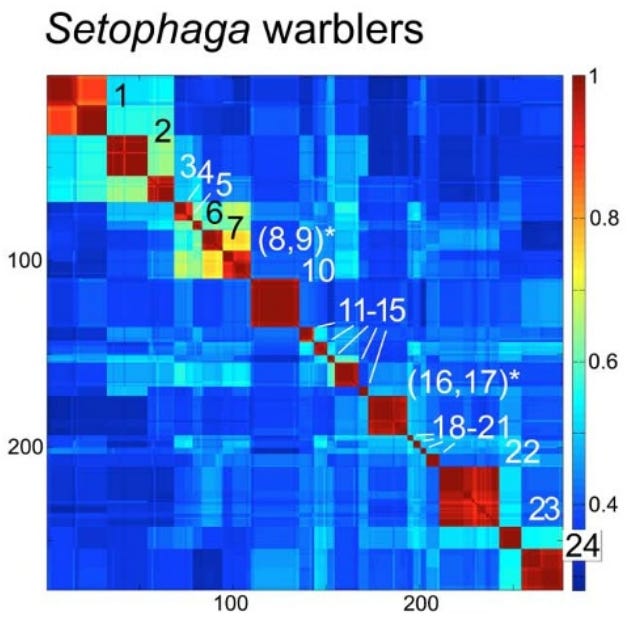
Species-level clusters in birds: Setophaga warblers COI barcode Klee. Blocks along the diagonal correspond to species; species with shared blocks are marked with an asterisk (1. petechiae, 2. striata, 3. pensylvanica, 4. nigrescens, 5. graciae, 6. discolor, 7. virens, 8. occidentalis,* 9. townsendi,* 10. magnolia, 11. tigrina, 12. castanea, 13. dominica, 14. palmarum, 15. citrina, 16. americana,* 17. pitiayumi,* 18. cerulea, 19. pinus, 20. kirtlandii, 21. fusca, 22. coronata, 23. caerulescens, 24. ruticilla). Stoeckle and Coffran 2013.

Evolutionary Implications: Why Mitochondria Define Species

A long controversy in biology concerns whether species are “real” or just human constructs. Dobzhansky, in his 1937 book Genetics and the Origin of Species, claimed that “Biological classification [of species] is simultaneously a man-made system of pigeonholes devised for the pragmatic purpose of recording observations… and an acknowledgement of the fact of organic discontinuity.”

Stoeckle and Thaler, in their 2018 paper “Why should mitochondria define species?”, expand on the evolutionary meaning behind these barcode clusters. They argue that the patterns seen in DNA barcodes are central facts of animal life that evolutionary theory must explain.

1. The “Barcode Gap” and Low Intraspecific Variation: Across the animal kingdom, the average pairwise difference (APD) within species is typically very low, between 0.0% and 0.5%. Meanwhile, the distance between even the most closely related species is usually 2% or more. This “gap” exists because intermediates between clusters are absent or rare.

2. The Neutrality of Synonymous Mutations: Most variation within and between these barcode clusters consists of synonymous substitutions; mutations that change the DNA sequence but not the resulting protein.

Stoeckle and Thaler argue that these changes are selectively neutral in mitochondria. This is because animal mitochondria are simpler than the nuclear genome; they lack introns (and thus splicing) and only have 22 different tRNA types. This lack of complexity means synonymous codons are less likely to affect the “fitness” of the organism, allowing them to accumulate as a “molecular clock”.

However, observed patterns of variation in DNA barcodes do not match the predictions of Kimura’s Neutral evolutionary theory of random accumulation of mutations.
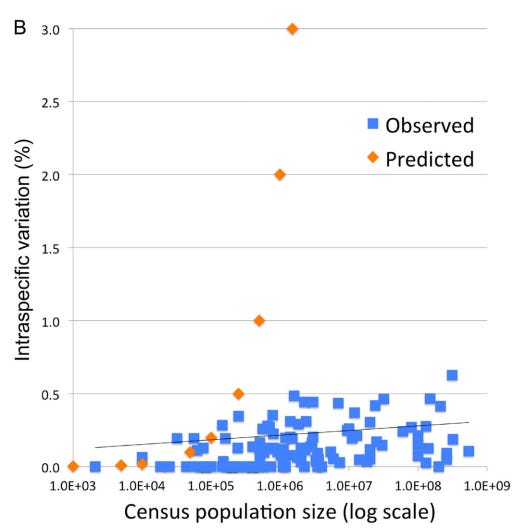
Intraspecific variation and population size among 111 bird species with census estimates; species with geographic or hybrid clusters were excluded. Orange markers indicate predicted variation for a model species under neutral evolutionary drift. Stoeckle and Thaler 2014.

3. A Recent Universal Expansion? To reconcile these observations, Stoeckle and Thaler’s use humans as a case example. Modern humans have an APD of 0.1%, which is about average for the animal kingdom.

Several lines of evidence suggest that human mitochondria originated from a state of uniformity approximately 100,000 to 200,000 years ago before expanding. Stoeckle and Thaler propose that the extant populations of humans, and almost all other animal species, arrived at a similar result due to a similar process of expansion from mitochondrial uniformity within the same recent geological timeframe.
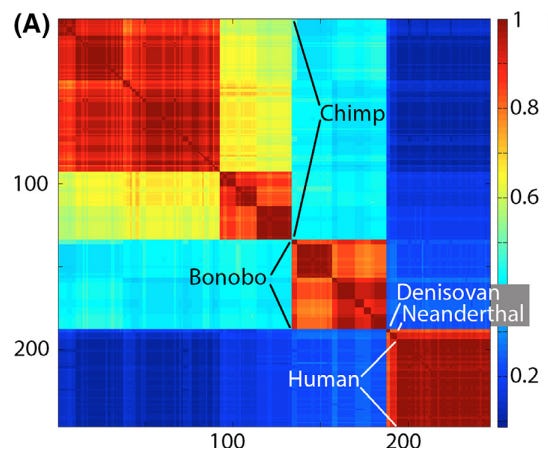
Klee diagram of mitochondrial genetic diversity of humans and our closest living and extinct relatives. The human sequences represent the span of known modern diversity. The Klee diagram heat map demonstrates greater mitochondrial diversity among chimpanzees and bonobos than among living humans. Thaler and Stoeckle 2016.

This coincides with Mayr’s 1942 idea that bottlenecks followed by expansion could explain speciation:

“The reduced variability of small populations is not always due to accidental gene loss, but sometimes to the fact that the entire population was started by a single pair or by a single fertilized female. These “founders” of the population carried with them only a very small proportion of the variability of the parent population. This “founder” principle sometimes explains even the uniformity of rather large populations…”
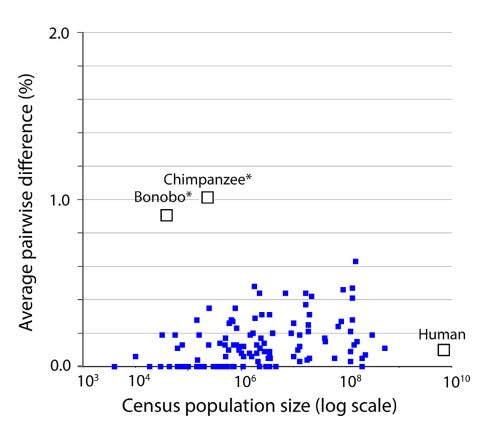
Mitochondrial genetic diversity, represented as average pairwise difference of COI barcodes, in relation to census population size in humans, chimpanzees, and bonobos compared to a well characterized set of birds (Stoeckle and Thaler 2014). Mitochondrial genetic diversity in humans is about 0.1%, less than that of many bird species, despite having more than 10-fold greater population than the most abundant bird in this dataset. Chimpanzees and bonobos have much smaller population sizes than humans, but conspicuously higher diversity, consistent with reproductively isolated subgroups. Thaler and Stoeckle 2016.

Conclusion

DNA barcodes and Klee diagrams do more than just identify species; they reveal a kingdom-wide pattern of organic discontinuity. Whether through population bottlenecks, lineage sorting, or gene sweeps, the uniform low variance across species suggests that the “islands” of biodiversity we see today are the result of deep evolutionary currents that affect all animals—from humans to birds to insects—in a surprisingly similar way.

Thaler and Stoeckler conclude their 2018 paper by noting that “there is irony but also grandeur in this view that, precisely because they have no phenotype, synonymous codon variations in mitochondria reveal the structure of species and the mechanism of speciation.”

Annotated Bibliography

Sirovich, Lawrence, Mark Y. Stoeckle, and Yu Zhang. “Structural analysis of biodiversity.” PLoS One 5.2 (2010): e9266.

- lays out math and originally defines “Klee diagrams”. Some examples.

Stoeckle, Mark Y., and Cameron Coffran. “TreeParser-aided Klee diagrams display taxonomic clusters in DNA barcode and nuclear gene datasets.” Scientific Reports 3.1 (2013): 2635.

- short and sweet version for Nature. Butterly and Warbler Klee examples.

Stoeckle, Mark Y., and David S. Thaler. “DNA barcoding works in practice but not in (neutral) theory.” PLoS one 9.7 (2014): e100755.

- first paper to note that the observed patterns in Klee diagrams, of homogenous species, doesn’t match neutral theory. OK.

Thaler, David S., and Mark Y. Stoeckle. “Bridging two scholarly islands enriches both: COI DNA barcodes for species identification versus human mitochondrial variation for the study of migrations and pathologies.” Ecology and Evolution 6.19 (2016): 6824-6835.

- short but good paper, cool data on humans, bonobos, and chimps, and comparison to results from their 2014 paper disproving neutral theory. Human/Chimp Klee example.

Stoeckle, Mark Y., and David S. Thaler. “Why should mitochondria define species?.” BioRxiv (2018): 276717.

- deep dive analysis that builds on 2014 observation that mitochondrial DNA barcodes don’t match expectations of neutral theory (”Species are islands in sequence space.”), while at the same time appearing to be created by neutral (synonymous) sequence changes. This is explained by evolutionary mechanisms of speciation, which has implications for how recent most species have become species. These results also help to resolve some of the disagreements about the definition of a species.

Duchemin W, Thaler DS (2023) PyKleeBarcode: Enabling representation of the whole animal kingdom in information space. PLOS ONE 18(6): e0286314.

- methods paper

Thursday, January 29, 2015

Can Patients Understand their Own Genome?

I just ran my 23andme SNP data (Single Nucleotide Polymorphism: basically, the distinct mutations that make my DNA unique) through geneticgenie.com, a website that puts the number and type of mutation in a handy table.  The website also provides nutritional recommendations based on the presumbed metabolic impact of my particular mutations.

However, after feverishly researching biochemistry I have some concerns with Dr. Yasko's conclusions cited on that site and others. These websites appear to make a number of biochemistry mistakes, and I'm not seeing a lot of citations to original research, just a lot of unpublished "physician observations".


A selection of results from G enetic Genie. There are two copies of most genes in our genomes (one from our father, one from our mother) and one or both may be mutated. The color-coded results show that I have two mutated copies of several important genes (colored red) involved in neurotransmitter metabolism and other core biochemical processes. I also have two genes with one bad copy (yellow),


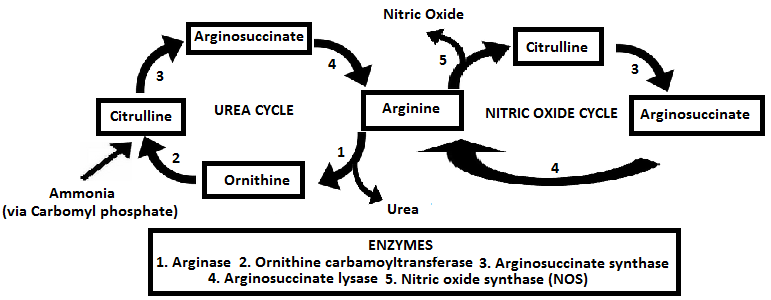
Some of the statements about, for example, BH4, appear to be incorrect. Genetic Genie states that impaired BH4 production or increased BH4 utilization can impact ammonia detoxification in the urea cycle, but BH4 is not directly involved as a cofactor in ammonia to urea conversion. Instead, BH4 is involved in one of at least two pathways for generating citrulline. (Citrulline is regenerated in the urea cycle to turn ammonia into urea.)


Not to say they're not doing good work, but you have to interpret biochemistry in context. For example, I am homozygous for a mutation in CBS, which they say would upregulate CBS activity and lead to increased cystathione, cysteine, and eventually to increased taurine and sulfite. But I also have a heterozygous mutation in CTH, which would limit the amount of cystathione converted into cysteine, effectively stopping that cascade at the starting line.

I hope we're just a short ways off from a website or interface that can actually map all of our unique (SNP-dependent) metabolic pathways, but I think we're still in the dark ages when it comes to interpretting SNP genome results. Promethease is the online tool that has replaced 23andme's health-specific genetic information, but the website only summarizes Pubmed results:


The Promethease website is great, but is based on observational studies with tiny effect sizes. Trying to infer causation from those correlational studies is a textbook example of how not to interpret statistics.

Faced with the complexity of ~20,000 SNPs and less-than-user-friendly professional tools like ENSEMBL, I don't think it is possible for individuals to understand how SNPs influence protein function to the extent necessary to make informed decisions about our biochemsitry.

Sunday, January 18, 2015

Don't Read This if you Trust Me: The Pitfalls of Trusted Sources

Keith Kloor reports that Daniel Kahan recently "said that 'people misinform themselves.' What did he mean by this? Well, people have go-to sources for issues they don’t have time (or the inclination) to research. Your go-to source on a contentious issue–such as climate change or GMOs–is likely to share your values. That affinity is what makes the source trustworthy to you. But that doesn’t mean your trusted source is necessarily going to provide you with correct information."

I disagree for two reasons: 1) That's not quite what Kahan is concerned about, and 2) I think there are some information sources that are able to resist ideological decisions -- and we would do well to turn to them in times of misinformation.

1)  Kahan has an excellent blog where he tries to explain his often counter-intuitive research.  For example: a study he conducted evaluating the relationship between numeracy and ideology.  He looked at a person's ability to detect statistical covariance in case studies that were value-neutral versus case-studies about hot-button topics like abortion and gun control.


Not surprisingly, people had a harder time correctly interpreting data about hot-button topics.  To be specific, people failed to properly analyze data when it conflicted with their ideology.  


Kahan likes to say that "critical reasoning is being used opportunistically."  And he goes on to point out that more proficient people (i.e. more proficient at value-neutral numeracy tasks) are more polarized than less proficient people, not because they are more biased (although this may be true) but because they are better at fitting the evidence to their existing ideological biases.  Importantly, this effect appears to be equivalent on both sides of controversial topics.  Neither liberals nor democrats have a monopoly on crazy baseless beliefs.

2)  This brings me to my second point.  Perhaps there are a group of people who are not liberal or conservative; people who do not have strongly-held opinions about anything apart from what the evidence provides.  Probably more people would self-describe themselves in this group than can actually live up to this standard, but still.  It seems to me that this would be the ideal of a dispassionate, objective observer.  A true scientist.  And if our go-to sources are value-less, or better stated, if our go-to sources hold objective knowledge as their highest value, than we are justified in turning to them for information.  Doesn't mean they can't be wrong, but if they have the characteristics I mentioned previously, then at least they are thoughtful, transparent, and open to conflicting data.

Presumbably Keith would support this second point, if he wants us to keep reading his blog!  However,  Keith Kloor goes on to point out that even trustworthy sources can hold fallacious viewpoints: "Groups like Greenpeace and thought leaders such as Michael Pollan, Vandana Shiva, and Bill Nye have enormous clout in their respective spheres. "  These people and groups earned this clout by speaking truth to power.  But that doesn't mean all of their opinions are objectively justified.  People can be rational about some topics, but irrational about other topics! 

Saturday, January 17, 2015

How To Find The Truth (on the Internet)

I recently read about two different meta-review techniques: the Total Evidence Approach and the Quality Analysis Method, and that got me thinking about information processing and knowledge creation in our information-saturation internet-era.  How do we find the truth on the internet?

"In the total evidence approach (Kluge 2004; Sherman et al. 2008) all information is considered and data are not weighed by quality of evidence. Although the total evidence approach is subject to the biases and errors of individual studies, we deemed it preferable to the alternative “quality analysis” method (Sherman et al. 2008) in part because of the difficulty of objectively evaluating the relative validity and quality of the widely heterogeneous data sets that we reviewed."  Source.

I think we can all agree that a total evidence approach isn't going to work very well on the internet: there is simply way to much junk to try to average out truth from the hubbub.  But how to engage a quality analysis?  Michelle Nijhuis describes an iterative process of fact-checking in journalism, wherein she continually seeks out new sources to comment on and counterbalance other sources, until ideally, after an infinite(!) number of steps, truth is reached asymptotically.  But she admits this approach is time-intensive and unwieldy.  Furthermore, this approach can lead to the problem of "false objectivity":  journalists actively obscure truth when they try to objectively treat controversial issues by giving crackpots equal weight with experts and scientists. 

Instead,  I use a balance of evidence approach to truth-finding in science debates: I read widely and then select trustworthy sources.  If a person or organization publishes unsupported or erroneous information, I tend not to give them a second chance.  Also, sources that don't include open debates are outed as substandard information sources and discarded from the analysis.  A process of winnowing results, and after several months (years) of research, only the best sources are left standing.

Typically, the best sources are: experts who publish in-depth analyses of primary sources (e.g. journal articles).  They are open to quality comments from a range of voices, and their work is therefore continually self-correcting

Interestingly, I often prefer blogs over than traditional journals in my research.  Bloggers can attain higher standards of truth than the peer-review system.  Journals are slow to correct mistakes and often don't include enough discussion to reveal divergent viewpoints.  

Monday, April 11, 2011

Best Periodic Table Ever


I've been on the lookout for the best periodic table for a couple months now, and have finally found it. Various versions can be downloaded here. An explanation of the new format.

Saturday, January 22, 2011

Microbiome and Disease: Experimentation, Gulf War Syndrome, and Mycoplasma


Humans are host to a large number of bacteria which may influence health and disease. Whether or not any given microorganism, such as E coli, becomes pathogenic is not understood. What is becoming increasingly clear is that, in addition to exogenous influences such as diet and exercise, endogenous factors such as bacteria (and genetics!) are crucial determinants of human health. Carl Zimmer, science writer, has proclaimed: "I, for one, welcome our microbial overlords!" after reviewing recent research establishing that certain bacteria can lead to obesity. His famous New York Times fecal transplant article is here.

In the absence of scientific certainty, groups of concerned citizens have begun moving forward, experimenting with antibiotics and probiotics to try to nudge the population dynamics of their microbiome toward healthier states. This emerging field, combined with the failure of the medical community to communicate and collaborate with patients who are sick and aren't being helped by currently available diagnosis or treatment has created fertile ground for web-based DIY experimentation. The community of Chronic Fatigue Syndrome sufferers in particular have latched onto research examining possible links between a tiny gram-negative bacterium called Mycoplasma fermentans and Gulf War Syndrome. The bacteria, which can apparently be a member of normal human microbial flora, is implicated in the vague symptoms of GWS, and by extension, CFS. A definitive book on GWS found little evidence to suggest such a link, but the initiator the research, Dr. Nicholson, has forged ahead nonetheless, starting a nonprofit research lab to investigate and link between Mycoplasma fermentans and health problems.

It is unfortunate that so much of the information available online is anecdotal. If these types of alternative medical practices could keep better data it may be possible to scientifically evaluate them. However, in the absence of peer-reviewed double blind trials, it appears many people are simply grasping for any treatment that offers hope, no matter how unsupported. Indeed, the scientific jury is still out, and this developing field may see fringe transformed into mainstream.

Research into M. fermentans is certainly controversial, but continuing: see, for example:


Kawahito et al. Mycoplasma fermentans glycolipid-antigen as a pathogen of rheumatoid arthritis. Biochemical and Biophysical Research Communications. 2008;369(2):561-566.