Showing posts with label iNaturalist. Show all posts

Friday, December 19, 2025

What's up with iNat in Japan?

 I recently listened to a fascinating podcast about the naturalist community in Japan, specifically the entomology fanatics. However, when I look at iNaturalist statistics for Japan, there appear to be very few observations/observers/identifiers given the population and level of development.

image

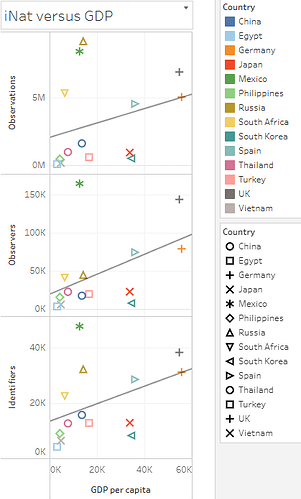
This figure shows the number of Observations, Observers, and Identifiers for select countries that have similar populations. Japan (red X) is way below the trend lines for all 3 metrics. The full dataset can be explored interactively on Tableau.

Interestingly, South Korea (blue triangle) clusters with Japan, although South Korea has a population that is less than 1/2 that of Japan.

Based on feedback from the iNat forum, it seems likely that nature-nerds in some of these countries are using other platforms to record their observations.

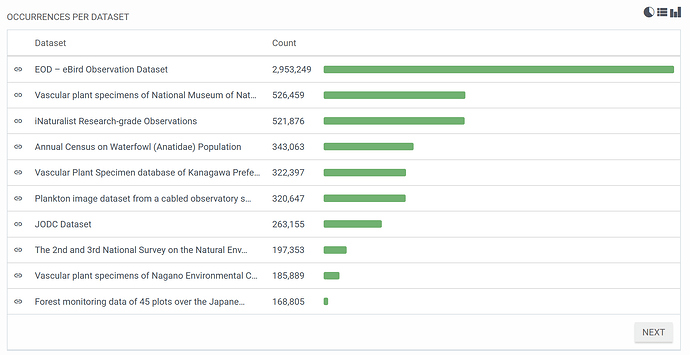
However, if they are using other platforms, they do not record data in a universal format that is indexed in the Global Biodiversity Information Facility (GBIF):

image

This chart shows GBIF records from Japan.

Hopefully over time more people will discover iNaturalist to record their natural history observations!

Tuesday, September 30, 2025

Tortoise Population Zone Trends

Continuing my analysis of iNat tortoise and reptile data, I looked at whether the observed changes in proportion of reptile species encountered was different in urban and urbanizing zones.  I hypothesized that the continuing expansion of large cities in tortoise habitat could be contributing to their decline.

Methods

I downloaded iNat data for AZ reptile species and mapped the points in GIS. I only looked at full species instead of including named subspecies as I had in my previous analysis. Based on that previous analysis, it seemed possible that changes in subspecies identification could be accounting for some of the observed changes and I wanted to remove that potential source of bias.

I then subjectively defined polygons around the large urban zones of Phoenix and Tucson and used the Identify tool to add Phoenix and Tucson labels to all points within those areas.  Note that although the study area includes other towns in Arizona (such as Prescott and Flagstaff) I did not choose to define those areas as "urban". 

Phoenix urban zone.  220 total tortoise observations.
Tucson urban zone:  795 observations.

I also considered whether geopoint accuracy would impact the results, so I conducted the following analysis including and excluding points with no or low (greater than 1000m) accuracy.  However, because I did not see a difference I will simply present results for all data points (i.e. no geopoint accuracy exclusion).

Results: Urban Zones

The majority of tortoise observations are from urban zones, especially Tucson.


It is not possible to determine if more tortoises live around Phoenix and Tucson compared to remote areas; iNat data collection is opportunistic, so places where people live are more heavily sampled than remote areas.  This result is an important caveat to my previous results: iNat observation trends are most representative of urban zones and any observed changes do not necessarily represent changes in all areas of Arizona.


The proportion of tortoise observations has been increasing in urban zones, especially Tucson. From 2013-2025, although there is some noise early on (e.g. 2014) due to low observation counts, the general trend is apparent that Tucson increased from ~45% to ~55% of total observations, while areas outside metro zones decreased from ~40% to ~20%.

This could contradict my hypothesis (that tortoises are declining in areas of urban development), or it could be due to increased observers in urban zones.   


Reptile observations show the same overall trend of increasing observations in urban zones. The proportion of iNat reptile observations for Phoenix increased from 10% to 20%, Tucson increased from 30% to 40%, and non-urban areas decreased from 60% to 45%.

Reptile Observation Trends

I wondered whether the amount of urban versus non-urban observations could explain the changes I observed in reptile species observations.

Updated Reptile Observation Trends

The 26 species of reptiles with more than 1000 observations

There were 26 species of reptiles with more than 1000 observations in the study area.  They ranged from species with 100% urban observations (San Esteban Island Iguana, introduced) to species with 0% urban observations (Plateau Fence lizard).  The colored cells show population change from a 2018 baseline.  Look for areas of red-green or green-red, because those indicate consistent trends from 2013-2025.  Red for both indicate 2018 was a high point.  Green for both indicate 2018 was a low point.  

I then plotted % change against proportion of non-urban observations to look for trends and outliers.


First graph: The point at 100% non-urban and 50% change is Plateau Fence lizard, which is very common in Prescott and Flagstaff, maybe that area should be an urban zone.  The point above 200% change is sidewinder, maybe someone was studying them back in the day?

2nd graph.  The point at 0% nonurban and 180% change is the iguana, introduced in Tucson.

Conclusion

Urban areas do not have a consistent negative or positive impact on reptile observation trends. It would be interesting to look at observation trends of individual species in each zone, but most species do not have enough observations for a meaningful statistical analysis.

At this point I can conclude that the large and increasing share of iNat observations from urban areas definitely affects the analysis of reptile observation trends, but I have not been able to identify a consistent bias that this would introduce into my overall analysis.


Sunday, September 07, 2025

Reptile Trends in Arizona

Introduction
In my previous posts, I showed that the relative proportion of iNaturalist observations was decreasing for Sonoran Desert tortoises. 

In my second post I investigated whether there were biases affecting the total number of observations, and while I found some, they did not change the results of the first post.  However, in that post I only compared total observations to large taxa that include hundreds of species, like birds, insects, and reptiles.  The question remains of the variability of other individual species besides tortoises.  Is the observed trend in tortoise observations normal or extreme?  

Looking at other individual species is problematic, because while I could assume that the actual populations of large groups of taxa would be relatively consistent over time, that assumption does not hold for individual species.  In other words, it is harder to investigate potential observer biases when looking at individual species because their populations may actually be increasing or decreasing.

Nonetheless, looking at other species can shed some light on the observed trends in tortoise observations.  I looked at other reptiles with the idea that they might have similar trends, and/or similar causes explaining their trends.  

Reptile Observation Trends
I downloaded all Research Grade observations of reptiles within the tortoise study area and decided to focus on species with more than 1,000 observations over the 2013-2024 study period.  There were 26 species that fit this requirement.  

iNat page showing representative reptile species included in this analysis.  

I then conducted a similar analysis to the last blog post.  To look at the changing proportion of observations for each species over time, I divided the number of observations for each species each year by the total number of reptile and total number of non-plant observations for that year.  To compare species to one another, I normalized all species proportions to a base year, either 2013 (to look at % change since 2013) or 2018 (to look at % change since 2018).  

Changes 2013-2024
Excel can only graph 10 measures at a time (due to a limit on the number of colors?), so there are 3 graphs presented below for % change of various reptile species compared to total non-plant observations.  % change compared to other reptiles is not shown, but is summarized in the table below.

Top 10 lizards by total observations:

Plateau fence lizard had large initial increase that continued.
Western side blotched lizard had large increase in 2013 (year 11)
Common side blotched lizard has had increases, but ended very near where it began
Greater earless lizard decreased to 50% by year 5 and then held steady.

Middle 10 reptile species . Sonoran desert tortoise points are highlighted:

Mediterranean house gecko had large increase in first few years, but has decreased again since year 6 (2018)
Sonoran gopher snake has been up and down 50% at different times
All of the other species have decreased.

Bottom few reptile species. Note different Y axis:

Table of top 25 most observed reptile species in study area, listed from most to least observed:

Average change when normalized to total observations in less than 4%, but standard deviation is 50%.
Largest increase was Plateau Fence Lizard 240% change as a % of total observations, and 333% change as a percent of reptiles. Other species with large increases were red-eared slider and western side-blotched lizard.
Largest decrease was Gila Monster, only observed 38% as much in 2024 compared to 2013 total observations, or 52% as much compared to total reptile observations.  Other species with large decreases were Gopher snakes, western banded gecko, and Sonoran desert tortoise.  

The large variability in % change means that the standard deviation is also quite large.  Therefore, few if any of these changes would be statistically significant.   For example, even the large decrease in proportion of gila monster observations is not more than 2 standard deviations from the mean.

It is interesting to note that these results are largely consistent when species are compared against reptiles or all non-plant taxa.  Therefore this analysis does not help explain the apparent decrease of total reptiles compared to all non-plant taxa since 2013 that I noted in my previous blog post.


Changes 2018-2024

To show all species on one graph, I used Tableau to visualize the % change each species.  In this case I am comparing each species to total reptile species, but again I present comparison data for both total reptile and total non-plant observation in the table below.


Summary table:

Average change when normalized to total observations in less than 10%, and less than 1% when compared to just reptiles. but standard deviation is still more than 30%.
Largest increase was western side-blotched lizard with more than 200% change compared to either total non-plant or total reptile observations.   Other species with large increases were long-nosed snake with more than 150% change.

Largest decrease was still Gila Monster, which continued to decline since 2018.  It was only observed 50% as much in 2024 compared to 2018 when compared to total non-plant or total reptile observations.  Other species with large decreases were northern black-tailed rattlesnakes, sonoran desert tortoises, meditgerranean house geckos, and clark's spiny lizard.

Identifications to species versus subspecies can be a source of bias
The large increase in western side blotched lizard, a subspecies of common side blotched  lizard that did not show a large increase, could be due to Identifications favoring the subspecies.  Same could be true for Sonoran Gopher snake, a subspecies of gopher snake that showed a decrease.  The increase/decrease between the subspecies and species could be due to a cultural shift as identifiers increasingly favor the use of the subspecies.   Note that Northern black-tailed rattlesnake is also a subspecies (of Western black tailed rattlesnake), but almost all of the observations in AZ are consistently identified to the subspecies, so the large decrease in observations of this subspecies is probably not due to identifier bias.

Conclusions
While tortoise was not statistically different from all other reptiles, its decline is among the largest, grouped with other species of conservation concern.

For changes across reptiles, there are several possible hypotheses for the observed changes.  Some species are probably actually increasing or decreasing.  Species increasing in places people live would be observed more often.  But:  even if that is generally true, it is not consistently true.  Otherwise most common species would consistently increase and least common would consistently decrease.

I rejected my hypothesis that common reptiles are observed more and less common are now observed less frequently.  However, there does seem to be more variability in less observed species.  This is why I set the lower limit for this analysis at 1,000 total observations.  Even 1,000 isn’t very many, just 100-200 observations/year.  These small sample sizes could explain some of the variability.
Friday, September 05, 2025

Sonoran Desert Tortoise - Follow Up

In my previous post "Sonoran Desert Tortoise Population Status", I argued that a decline in the ratio of tortoise observations to total iNaturalist observations indicated a possible decline in the actual population of tortoises.  

However, that conclusion rests on the assumption that opportunistic "citizen science" observers have not changed their preferences in photographing other animals.  This could happen if people became less interested in tortoises, or if they became more interested in other taxa.  

Part 1: Trends in Other Taxa

I analyzed various other well-represented taxa in the iNat data to look for possible trends in observer preferences.  Specifically, I looked at all Research Grade (RG) iNat observations of amphibians, reptiles, insects, birds, and plants in the study area: 

Data table with total RG amphibian, reptile, insect, bird, and plant observations in the study area each year.

These are large taxa made up of many species and I expected that the ratio of observations would remain relatively consistent. 


Count of observations by taxa 2013-2024

Observations of all taxa have increased over the last 10 years, but some appear to have increased more than others. I divided the count of each taxa's observations by total observations to investigate proportional changes in the ratio of various taxa:

Ratio of various taxa to total observations 2013-2024

The ratio of various taxa has changed over time.  Specifically, the ratio of plant observations to total observations doubled in 2017.  
I don't think this could be due to an actual increase in the number of plants in AZ.  

Instead, I think this must be an indication of a changed bias toward plants, perhaps due to specific iNat users who focus on plants, or a general trend toward more plant-focused observers on iNat.  Plants, because they don't run away, are arguably the easiest organisms to photograph; it could be that as iNat has grown there are now more casual users biased toward photographing easier to observe organisms.  

Regardless of why iNat users are observing proportionally more plants, this appears to be a source of bias that should be corrected in my analysis.    

To correct for the large increase in plant observations, I compared various taxa to total non-plant observations: 

Ratio of various taxa to total non-plant ("total2") observations 2013-2024

This shows a fairly consistent observation ratios for the major animal taxa over the last 10 years.  While there is some year to year variability, there are no long term trends, except reptiles.  Reptiles in general are photographed 71% as often in 2024 compared to 2013. Most of this drop occurred from 2015-2017, with no major changes since then.  It is not clear why reptiles as a group declined in representation.  There are other reptile species of conservation concern besides tortoises and it is possible that reptiles actually are declining, or there could be other sources of observer bias in the data, similar to the trend in plant observations above.

Except for reptiles, all taxa ratios stayed within approximately +/- 15%:

Table: percent change in ratios of various taxa since 2013 and 2017.


Part 2: Another Look at the Tortoise Trend

The analysis in Part 1 led to a refinement in the total observation count used to create ratios, and helped set a baseline for expected change in ratios over the last 10 years.  I used this information to reassess the observed decline in ratio of tortoise observations.  

Tortoise observations were compared to various taxa and to total non-plant observations:

Percent change in the ratio of tortoises to various taxa and to total non-plant ("total2") observations 2013-2024

The ratio of tortoise observations has decreased since 2013 for all 4 animal taxa investigated, and for total non-plant observations.  The decline is remarkably consistent for amphibians, birds, and total non-plant observations ("total2"), and fairly consistent for insects.  The ratio of tortoise to reptile observations tends to fluctuate over time, while maintaining the same overall negative trend.

While most animal taxa ratios show less than 15% change from baseline (Part 1), tortoises are observed 66-84% (mean 72%) in 2024 compared to 2017, and 35-57% (mean 43%) in 2024 compared to 2013:

Table: percent change of tortoise observations to various taxa and to total non-plant observations.

Conclusions

Tortoises show large declines compared to various representative animal taxa and compared to all non-plant observations.  This is the same result I found in my original blog post when I compared tortoises to all observations.  

The result was not affected by removing a potential source of user bias, showing that the original result is robust to some observational biases.  Of course, there will always be more sources of bias that could be analyzed and corrected for.  However, the fact that correcting for one source of bias didn't change the result makes me somewhat more confident that this result is directionally correct.

Conversely, the fact that I did find a large source of observer bias makes me wonder whether there are other large biases in iNat observation trends.  Without analyzing all sources of bias (why did reptiles change in 2017?) these results must remain clouded by potential uncertainties.  

The result was also not affected by which taxa I compared tortoises with, showing that the original result is robust to choice of comparison.  Tortoises appear to be declining, whether they are compared to all observations, all animals, amphibians, reptiles, insects, or birds.  While it is possible that one or more of these taxa are affected by observational bias, the fact that they all point in the same direction makes me more confident that this result is directionally correct and reflects an actual downward population trend.

Saturday, August 30, 2025

Sonoran Desert Tortoise Population Status

 Abstract

Population trend data for species under consideration for federal protection is often limited. This study evaluated Sonoran desert tortoise (Gopherus morafkai) population trends in Arizona using iNaturalist citizen science data. We analyzed 1,402 research-grade tortoise observations and normalized them against total observations in the area to account for sampling bias. While both tortoise observations and total observations increased since the early 2010s, the ratio of tortoise to total observations declined consistently from 0.12% to 0.08% between 2017-2025. This decreasing ratio suggests either shifting observer preferences or declining tortoise encounter rates, potentially indicating population decline. These results provide concerning evidence of negative population trends for this species of conservation concern and demonstrate the utility of citizen science data for monitoring species lacking formal survey programs.


Introduction

Sonoran desert tortoise (Gopherus morafkai) live in the Sonoran desert of Arizona and northern Mexico.  A closely related species in California and Nevada, the Mojave desert tortoise (Gopherus agassizii), is Federally protected as a Threatened species under the Endangered Species Act (ESA).  The Sonoran desert tortoise is listed by AZ as a Species of Greatest Conservation Need (SGCN) and was proposed for protection under the ESA but determined "Not Warranted" in 2022.  On June 4, 2025 wildlife groups filed suit in federal court challenging that determination.  

It is difficult to find current population trend data for species that may warrant listing under the ESA, so I attempted to do so using publicly available iNaturalist data.  iNaturalist is a public repository of photographic observations of species.  

Methods

I filtered iNat for Research Grade observation of Sonoran desert tortoises in AZ and found 1,402 observations. I considered limiting the analysis to only live tortoises, but eventually decided to use all research grade observations due to the difficulty filtering. Only ~3% (44 observations) were annotated as dead , and only ~1% (12 observations) were annotated as scat.  

I created an Area of Interest (AOI) bounding box around the tortoise data to search for total RG observations.  There were a total of 1.2 million RG observations in the Sonoran desert of southern AZ.

RG tortoise observations in AZ with bounding box showing AOI.  

More tortoises are observed in places where there are more people to observe them.  Because iNat data is based on opportunitistic data collection, it is liable to biases based on where people live as well as how many people use iNat.  To attempt to correct for this, trend analyses can normalize the count of tortoise observations as a ratio of total observations in the AOI.


Data

Data table of AOI with Total RG Observations, Total Observations, RG:Total Observations Ratio, RG Tortoise Observations, and RG Tortoise: RG Total observations.


Results

Total RG observations in the AZ Sonoran desert have been increasingly consistently since the early 2010s.

Count of total RG observations in the AOI per year.

Tortoise observations have increased since 2013, with some notable dips in 2020 and 2023. It is possible that these dips are due to weather-related impacts to tortoise population, but they could also be due to differences in number of observations.  


Count of tortoise observations per year.

By comparing tortoise observations to total observations, a normalized ratio can be derived. This ratio decreases over time. There is a step change decrease in 2017, which could be a real population decrease or could be due to the huge increase in popularity of iNat in 2017.  However, even if only looking at 2017 -2025, there is still a long term decrease in the ratio of tortoise observations, from around 0.12% to 0.08% of total observations. 


Ratio of tortoise observations to RG observations. 


Discussion

The decreasing ratio of tortoise observations indicates that either people are trending to preferentially observe other species more than tortoises, or that tortoises are making up a smaller percentage of the animals people encounter.  

Despite limitations of citizen science data, these results provide concerning evidence of negative population trends for this species of conservation concern and highlight the utility of iNaturalist data for monitoring species that lack formal survey programs.

Tuesday, May 13, 2025

What's up with iNat in Japan?

I recently listened to a fascinating podcast about the naturalist community in Japan, specifically about their interest in entomology. However, when I look at iNaturalist statistics for Japan, there appear to be very few observations/observers/identifiers given the population and level of development. 


This figure shows the number of Observations, Observers, and Identifiers versus per capita GDP for select countries that have similar populations. Japan (red X) is way below the trend lines for all 3 metrics.  Mexico (green asterisk) is way above trend.

Interestingly, South Korea (blue triangle) clusters with Japan, although South Korea has a population that is less than 1/2 that of Japan.


Japan clusters with the Philippines and Egypt based on population.  Interestingly, the trend lines for iNat statistics and total population are not as consistent as per capita GDP.  (China is excluded from the chart above and the one below because its population is an outlier compared to the other countries.)

This chart shows total GDP versus Observations, Observers, and Identifiers.  Japan is a clear outlier in the bottom right corner with a high GDP but low iNat statistics.

Conclusions

In this dataset, the strongest r value was Observers versus per capita GDP.  The second highest was Identifiers versus Total GDP.  The lowest was Observers versus Total Population.  This is consistent with the hypothesis that level of development (as measured by GDP) is the strongest predictor of iNat usage. 

For an interactive version of these charts on Tableau Public, use this link: https://public.tableau.com/app/profile/alexandra.permar/viz/iNatCountryComparison/

Wednesday, January 22, 2025

iNat Isn't Slowing Down in Arizona

The iNaturalist website collects species observations from people all over the world.  It started in 2008 and grew slowly at first and then entered a period of rapid growth in 2017.  As a consequence, the number of species recorded on the website is constantly increasing, passing 300,000 in 2020.  The website is currently adding more than 50 million observations a year. This raises an interesting biodiversity question: how long can the number of species keep increasing?  Another way of stating the question: how many species are there?

Biodiversity scientists use species accumulation curves to estimate the total number of species in a given area.  As they investigate a new study site, they record new species and the date/time the species was observed.  For most sites, the number of new species increases rapidly as scientists describe common species; the number of new species slows as scientists search for more and more rare species.  Graphing the number of species over time should reveal a logarithmic curve.  Based on the equation for that curve, scientists can estimate the asymptote - the number of species the curve will eventually reach given enough time.  This allows scientists to estimate the total number even if they don't finish counting all of the species.


This slowing down does seem to be happening for total species count on iNat.  For example, the 2024 Year in Review showed 50 million observations over the year, and about 1,000 new species (not previously observed and posted to iNat) per month.  

From iNat 2024 Year in Review

In contrast, back in May 2019 more than 6,000 new species were added.  It appears that 2019-2020 was the peak for adding new species, and even as more new users have joined iNat, fewer and fewer new species are being observed.  

These charts show running totals, with new additions colored, so that the logarithmic curve is more visible in Newly Added Species:

From 2024 Year in Review

There were fewer observations and many fewer users in 2019-2020, than now, but the rate of newly added species was much greater.  This appears to indicate that it is getting harder and harder to find new species to add to iNat.  Observable species on iNat are those that can be distinguished with photographic evidence, usually limited to smartphone cameras.  So this estimate does not include microbial life, and probably excludes most microscopic life.  

Its possible that unobserved species are mostly in the middle of remote wilderness areas and that is why fewer and fewer are being observed.  But many of the new species are from the US and Europe - there's still lots to explore!

For example, in Arizona the species accumulation curve is still effectively linear, with about 700 new species each year.  No signs of slowing down here!


The same is true of smaller areas within AZ, for example the Prescott National Forest averages 186 new species observed each year.  

I considered whether the new species could be due to rare birds and insects showing up for the first time.  I also analyzed new plant taxa on Coconino National Forest.  Plants are well-studied and the forest has been extensively surveyed, so it seems unlikely that new species would be discovered yearly.  But, according to the iNat data, not only are new species being continuously discovered, there is no detectable slow down in the rate of discovery!


I'm not sure what conclusions to draw from this analysis.  The standard conclusion would be that we haven't sampled enough species yet to begin to see the rate of new species discoveries slowing down.  This implies that the total number of species is quite a bit greater than the number that have been recorded so far on iNat.  

Another interpretation could be that the actual number of species isn't constant.  In other words, there could be new plants showing up each year on the Coconino.  This could be due to new invasive species, shifting distributions of native species.  It could also be impacted by taxonomist naming conventions; the number of species in even well-explored areas could increase as botanists work to name and describe the huge floristic diversity of the world.

There is still a lot of biodiversity to explore, even in our backyards!

Monday, July 15, 2024

The case for using geography to understand phenology

 Alexandra Permar and Conor Flynn collaborated on this project.

Calochortus is an astonishingly diverse genus of flowering monocots, with common names that include Mariposa lily, Sego lily, and globe lily, as well as pussy ears, fairy-lantern, star-tulip, and others.  Their center of diversity is in CA, which has 48 out of the 78 total species in the genus.  In Arizona, there are 6 species, ranging in color from white, to pink, to yellow, and sometimes orange, with diagnostic darker markings on the inner base of the petals.  


    This genus in Arizona makes an interesting case study of biogeography and phenology because each species occurs in a relatively distinct (but overlapping) elevation and geographic location.  Also, because the flowers are very showy, there are more than 2,400 Research-grade observations documented on iNaturalist.   

    The plant grows quickly from underground tubers in the spring, flowers quickly, and then dies back; the growing stem and then the seed heads are relatively inconspicuous and are rarely photographed.  This means that almost all of the iNaturalist observations are of the flowers, which makes studying the phenology easier because there is less work needed to annotate images as flowering or not flowering.  Nevertheless, we still reviewed observations and annotated and removed any photographs that didn't show flowers from the phenology analysis below.  

Methods 
Research-grade Calochortus observations in AZ were exported from iNaturalist and processed in Excel and graphed in Excel and Tableau.  iNaturalist Research-grade observations are used for research, but observations with inaccurate locations can lead to misleading analyses and must be removed.  
A total of 2350 observations were exported.  Taxa were classified by species (even though subspecies IDs exist for several hundred observations).  Cleaned records with geopositional accuracy > 1000 m (excluding blanks; there are 594 blanks).  Removed 61 records with geoprivacy obscured. (In iNaturalist, obscured geoprivacy impacts the geopositional accuracy of an observation to +/- 500 square kilometers.)  8 observations were noted as not flowering and were removed from analysis.  After cleaning, the database contained 2066 records (observations).  This shows that about 88% had location precision that met our inclusion criteria.


 Calochortus kennedyi had the most observations (782),  C. ambiguus and C. flexuosus tied for 2nd most observations (534), while C. aureus (148) and C. nuttallii (61) had the least number of observations. 

Geocoding Elevation
iNaturalist does not record elevation of observations, so it is necessary to intersect the observation points with a Digital Elevation Model in GIS.  Observations were added to ArcGIS Pro and displayed using their XY coordinates.  Connect to elevation in Esri AGOL Living Atlas : Ground Surface Elevation - 30m (image service / raster DEM).  Use Geoprocessing tool Extract Multi Values to Points ( Need Spatial Analyst license).  Copy resulting data back to excel. 
        Tableau Public was used to graph data.  Calochortus Bio-Geo-Phenology | Tableau Public

Results: Biogeography and Elevation
    Ordered by average elevation, Calochortus kennedyi and C. flexuosus are the lowest elevation species, C. aureus, C. ambiguus, and C. nuttalli occur at middle elevations, and C. gunnisonnii occurs at the highest elevations.  


C. kennedy (blue) is clearly visible at lower elevations along the foothills of the AZ mountains, and then extends to the West beyond the distribution of any other species.  C. flexuosus (green) is also visible to the NW of AZ, extending through central AZ in the lower elevation valleys of the Verde, Salt, and Gila rivers.  C. gunnisonnii (purple) is clearly visible in Colorado, barely extending down to the high country in AZ.  C. aureus (pink) stakes out a unique territory on the Navajo nation in NE AZ and SE Utah. C. ambiguus (red) is found throughout the mountains and high country of AZ.  


 Graphing both latitude and elevation help to illustrate this biogeographic comparison.  In the graph below, it can be seen that C. kennedyi is the most southerly of our Calochortus, and occurs at the lowest elevations.  C. flexuosus occurs farther north, but also at low elevations.  C. ambiguus marks out a consistent territory at higher elevations than other species, depending on elevation. Gunnisonii is a clear outlier, occuring only at high elevation in our study area.  There is a fair amount of overlap between C. aureus and C. nuttallii.
        This biogeographic comparison can help differentiate similar-looking species.  There are 4 white Calochortus in AZ.  C. gunnisonni is clearly only a high elevation species, although C. ambiguous can also occur at high elevations.  In the northern part of the state, C. flexulosus occurs at lower elevations, C. nuttallii at middle elevations, and C. ambiguous only occurs at the highest elevations. 


Results: Phenology
Overall, for Calochortus species in AZ, flowering begins at low elevations around week 13 (last week of March) and progresses to higher elevations, generally wrapping up around week 29 (third week of July).  Flowering species composition changes from C. flexuosus and C. kennedyi to C. ambiguus, with C. aureus and C. nuttalli thrown into the mix.  C. gunnisonni (barely visible at the far upper right) is, of course, the last to flower.  This chart also highlights how C. aureus is mainly restricted to 1600-1800 meters ( 5200-5900 feet).  


    Calochortus ambiguus shows the strongest relationship between elevation, latitude, and flowering date.  Based on this scatterplot, we were able to confirm that the location is not accurate for the observation at the far left side of the plot. 


Calochortus kennedyi, C. aureus, and C. flexulosus do not show as strong of a pattern, and C. gunnisonnii did not have enough observations in AZ to analyze.  
Example of C. kennedyi:


Graphing flowering week of C. kennedyi separately for Latitude and for elevation shows that there is some pattern, but it is clearly quite week.  The R squared values for these charts are 0.22 and 0.12.  Interesting, it looks like flowering actually starts at middle elevations (around week 11), then flowers appear at lower and higher elevations (week 16), until finally only the higher elevations are still flowering (week 20).  C. aureus and C. flexulosus show somewhat similar patterns (data not shown).  

Discussion
    There are many possible ecological and data collection reasons for weak r values:
1) Micro-site variation: south-facing aspect may have more impact than elevation.  Whether a site is forested, if there are shadows from cliffs, etc.
2) Genetic variation:  if a single species showed up with 2 distinct populations, that would be evidence for possible speciation or subspecies, but all populations showed continuous variation.  There may still be genetic variation between meta populations, or within single individuals.
3) Flowering period not known: our records only show flowering presence, not the start of flowering or the total period of flowering.  Correlations might be better if we had complete data, but our data is not complete: we only have point observations.  For example, if species A flowers from April 1-30 and Species B flowers from April 28-May 28, a visitor on April 28 would record both species as flowering at the same time, even though they do have distinct flowering periods.  

Friday, May 24, 2024

Joshua Trees Flower Episodically in Arizona

Intro

Joshua trees are large, visually-striking trees in the Mojave desert.  Most of them are in California and Nevada, but there is also a population in the western part of Arizona.  They are frequently photographed and there are more than 17,000 observations (1,000 in AZ) saved on iNaturalist, a website and app used to document biodiversity.  

Arizona Joshua Tree locations observed on iNaturalistiNaturalist.

Joshua trees produce showy clusters of white flowers at the tips of their branches in March, but this year I noticed they were not flowering.  I wondered how often they produce flowers and decided to answer this question using data from iNat.

53 observations in Arizona showed evidence of flowering, always in March and April.  

Methods

iNat observations of Joshua Trees (Yucca brevifolia) in Arizona were marked using the Plant Phenology option in the Annotation Field.  Plant phenology (flower budding, flowering, or fruiting) was determined based on visual inspection of the saved photos in iNat.

The iNat website has a nice phenology visualization tool.  This view is filtered to show only Arizona observations.  However, it cannot show differences in phenology from one year to the next.  

Observations were then filtered on the iNat Explore page by adding &term_id=12&term_value_id=13 to the URL and downloaded for analysis in Excel.

More info about using iNat search URLs.


Results

I graphed the results starting in 2017, because there are fewer iNat observations before 2017.  It appears Joshua Trees flower episodically.  According to this data, Joshua Trees flowered in four out of the last 7 years.  They appear to alternate years from 2017-2020, but then skipped 2021 and flowered in both 2022 and 2023.  


It is interesting to note that the Arizona Joshua Trees didn't flower in 2020, which was one of the wettest springs in the last 10 years. I wonder whether the spring moisture determines flowering, or if perhaps other climate variables, such as moisture in the fall, are more important.  Another possibility could be that the trees are only able to flower every other year, and that the trees were inhibited from flowering in 2020 because of the large number that flowered in 2019.  

According to this data they were able to flower in both 2022 and 2023, but at reduced numbers both years.  Perhaps the plants flowering in 2023 were different from the trees that had already flowered in 2022?  I can't answer that question with this iNat data.  While it appears that the areas of flowering in 2022 and 2023 were the same, not all of the Joshua trees in a given area necessarily flower, even in good years...