As explained by "Geomorphology: Themes and Trends". The book is worth it just for the classic essay on erosion and runoff. A combination, it turns out, of pore size and particle characteristics.
These images are from Chapter 5, "Geomorphological processes, soil structure, and ecology" written by A.C Imeson. Yes, the x-axis is scaled as square-rooted minutes.
Plant roots can change both the permeability and wettability of soil (as well as many other qualities). For more information, read Reid, TB and Goss, MJ. 1981. Effect of living roots of different plant species on the aggregate stability of two arable soils. Journal of Soil Science.
The book also has a chapter on the Geomorphology of stream channels and craters on Mars!
Showing posts with label geomorphology. Show all posts
Friday, January 24, 2014
Friday, July 12, 2013
Regolith and Quarternary Sedimentology: questions to infer paleogeomorphology and paleoclimate
This image was taken along Las Huertas creek, near the village of Placitas. Note the lack of developed soil horizons: the top layers appear to be unconsolidated colluvial debris. Perhaps the sandstone layers below the Juniper roots are paleo-sand dunes? What then might the different colors indicate?
This image and the following were taken along La Jencia creek, deeply incised into Pleistecene and Holocene sediments in the San Lorenzo Spring quandrangle west of Socorro, NM. The layers exposed along the creek channel show darker clay and/or organic-enriched layers that may have formed from swamps and/or backwaters along paleochannels.
Screenshot of the Quandrangle geological map, with a red dot on La Jencia creek showing the location of the photos.
This exposure reveals an unconformity in the left-center that may be due to in-filling of a paleo channel? Does this images show an actual unconformity, with deposition, then erosion, then deposition? Or was there continuous deposition? Why is there banding of light and dark material in such regular layers? How were these layers laid down? Does the fact that they were deposited indicate an aggrading landscape, perhaps controlled by climate-influenced sediment supply??
This photos shows a close-up of a tiny (5-foot long) layer of darker clay, clearly deposited in a concavity. Note the coarser sediment deposited below it and the finer sediment above. How old are these layers? How do geologists infer the direction of paleoflow? Why aren't there fossils?
Surface geology maps of the area offer confusing clues to interpreting these buried layers. The geological map for the quandrangle to the North of San Lorenzo Springs (the Silver Creek quandrangle) shows paleochannel flows on the surface, as well as relictual dunes from some point in the Quarternary. Why are the paleochannel flows going every which way? Was this whole valley a closed basin, and if so, would that explain the aggradation, independent of sediment supply? Why is this stream downcutting so rapidly today? What are the implications for the future?
This image and the following were taken along La Jencia creek, deeply incised into Pleistecene and Holocene sediments in the San Lorenzo Spring quandrangle west of Socorro, NM. The layers exposed along the creek channel show darker clay and/or organic-enriched layers that may have formed from swamps and/or backwaters along paleochannels.
Screenshot of the Quandrangle geological map, with a red dot on La Jencia creek showing the location of the photos.
This exposure reveals an unconformity in the left-center that may be due to in-filling of a paleo channel? Does this images show an actual unconformity, with deposition, then erosion, then deposition? Or was there continuous deposition? Why is there banding of light and dark material in such regular layers? How were these layers laid down? Does the fact that they were deposited indicate an aggrading landscape, perhaps controlled by climate-influenced sediment supply??
This photos shows a close-up of a tiny (5-foot long) layer of darker clay, clearly deposited in a concavity. Note the coarser sediment deposited below it and the finer sediment above. How old are these layers? How do geologists infer the direction of paleoflow? Why aren't there fossils?
Surface geology maps of the area offer confusing clues to interpreting these buried layers. The geological map for the quandrangle to the North of San Lorenzo Springs (the Silver Creek quandrangle) shows paleochannel flows on the surface, as well as relictual dunes from some point in the Quarternary. Why are the paleochannel flows going every which way? Was this whole valley a closed basin, and if so, would that explain the aggradation, independent of sediment supply? Why is this stream downcutting so rapidly today? What are the implications for the future?
Riparian Restoration Quandary
Plants along rivers face a basic quandary: the closer to the channel they grow, the more water they have. But, closer to the channel, there is more disturbance from flooding.
So:
It has:
It might be important to ask: What is bankfull here?
It might also be important to know that this is actually a dry wash, photographed after the first rain in 9 months...it looks grazed, and it is grazed. By a herd of native Elk, forced out of the uplands by the worst drought in 50 years.
We have to be careful to set our ecological expectations to the history of natural disturbance and the reality of a changing climate.
So:
- Is this a healthy/unhealthy stream bank?
- Is it in need of restoration?
It has:
- invasive species
- sparse vegetation
- obviously eroding banks....
It might be important to ask: What is bankfull here?
It might also be important to know that this is actually a dry wash, photographed after the first rain in 9 months...it looks grazed, and it is grazed. By a herd of native Elk, forced out of the uplands by the worst drought in 50 years.
We have to be careful to set our ecological expectations to the history of natural disturbance and the reality of a changing climate.
Friday, July 05, 2013
La Jencia Flash Flood!
Moving at about 5 miles per hour (as judged by floating tumbleweed), the front of the flood (visible here with lots of foamy flotsam) made a roaring sound easily audible at the ranch house. The brunt of the thunderstorm had passed more than half an hour previous. Based on cross sections of this reach, the flood was only about 30cm deep, and represented a flow of approximately 50 CFS. This amount of water may be "bankfull": the bank-side sedges were underwater, the willow got their feet wet, and no major channel geomorphic changes occurred.
Advancing front of flash flood.
The next day.
Flooding along old channel where side canyon empties in. This channel was abandoned in 2009 when the creek cut through a meander bend.
Wednesday, March 27, 2013
Saturday, September 26, 2009
Calibrating Bank Full Measurements Using Regional Curves and USGS Stream Guage Data
Bankfull is important to fluvial hydrogeomorphology (HGM) because it often determines the shape of the channel by moving and depositing sediment. Bankfull (BF) is defined as the high water level that recurs every 1 - 2 years, but measuring it in the field involves using multiple indicators in a 'preponderance of evidence' detective-style approach.
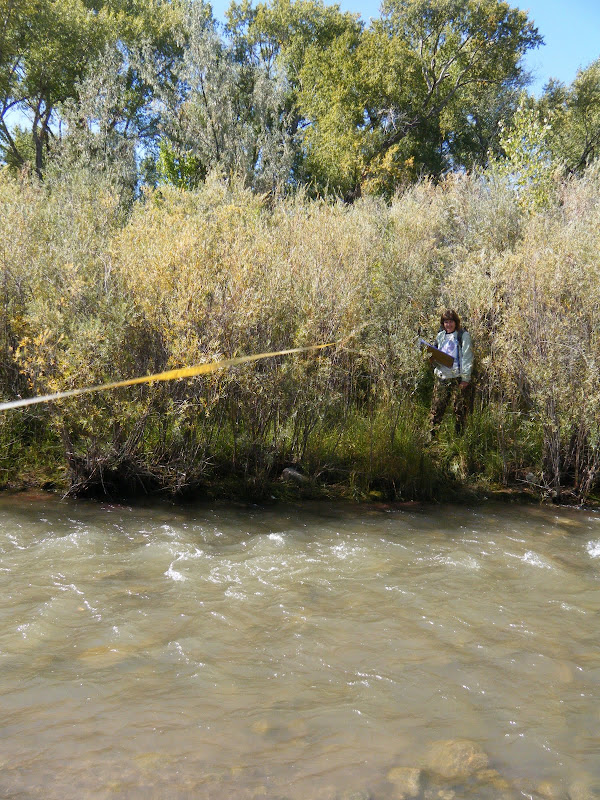
Most plants that cannot tolerate saturated soil conditions for days at a time, like Alders, will not grow below BF, while willows and cottonwood can. Also, the top of point or side bars can indicate the height of BF, but on the Rio Embudo, near Dixon NM, BF indicators were contradictory and hard to find. Is BF just a few centimeters above the base-flow water, or are all the willow below BF?
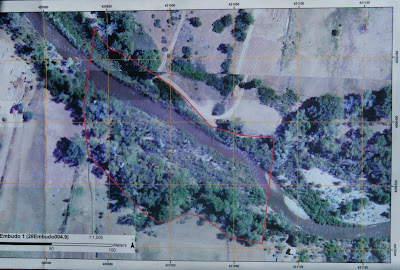
A number of bars and scour features at different heights further compounded the mystery. It was time to seek out other clues. One source of potential indicators was our aerial imagery, which was taken during Spring runoff, 2008:
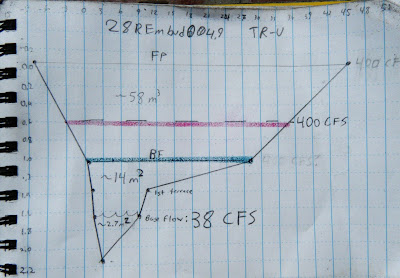
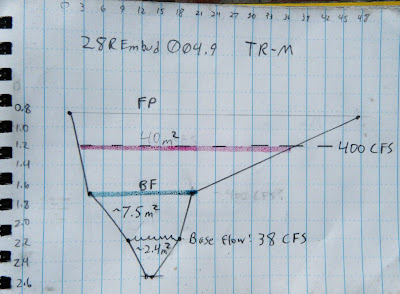
The point bars at bottom right are bisected by a side channel that is several feet above the base level today. That means BF must be at least that high, and would probably inundate most of the willows. Corroborating this, the landowner reports that the willows are indeed flooded almost every year. But exactly how high is BF? To gather more data, we surveyed three channel cross sections, or transects (TR), noting the heights of the major terraces.
TR-Upper
TR-Middle
Tr-Lower
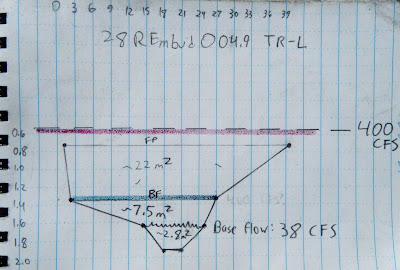
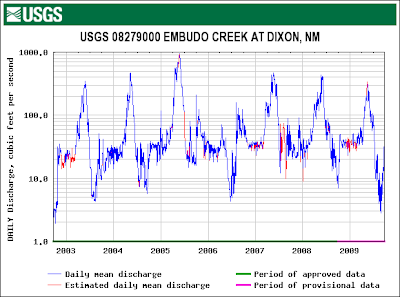
On each of these cross sections we marked where the current base flow water level is, where we think BF is, and where we think Flood Prone (FP) might be. To check these guesses, we correlated those heights with flow data from a USGS gauge just downstream:
From this graph we could see that the high water level with recurrence every 1 -2 years is about 400 cubic feet per second (CFS). We could also see that the current flow was about 38 CFS. If the Rio Embudo is flowing with 38 CFS today, how high would a BF flow of 400 CFS be?
between the flow today and BF flow. To figure that out we might need to correct for any changes in the velocity (feet/second). Manning's Equation:
shows that velocity V is proportional to a constant, u, inversely proportional to a coefficient of friction, n, varies to the 2/3 power of channel cross-sectional area, R, and to the 1/2 power of slope, S. Since neither slope nor the constant would change, we can discount them and focus on n and R; n will likely increase because the willows will act like a series of giant combs, increasing friction, and R will also obviously have to increase. For example, doubling the height of the water would multiply that term by 1.6. Unfortunately, coefficients of friction need to be experimentally determined, so we can only guess at n. To make things easier, I decided friction would also increase by a factor of 1.6, to exactly cancel out R. In other words, I don't think the velocity would change by much.
So it is a simple matter of geometry to calculate the cross-sectional area that would correspond to 400 CFS on our cross sections (red lines on the cross-sections, above). Without exception, this height is higher than our field-determined BF (green lines on the cross-sections, above) and, at least for TR-L, even higher than our FP height.
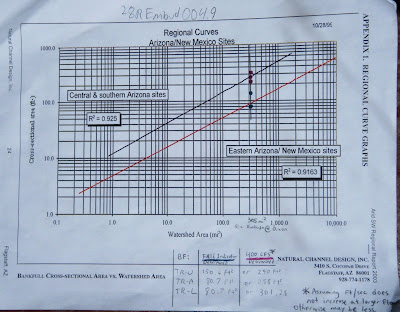
But is this right? Are we getting closer to the truth? To check, we can calibrate our answers for the Rio Embudo against data published by Natural Channel Design on a large number of other Southwestern rivers:
I plotted both our field-determined BF cross-sectional area (green points) and the USGS-determined BF cross-sectional area (red points) on the regional curve above. The green points seem to fall on the line for New Mexico, while the red points fall on the Arizona line, corroborating our field measurements and casting doubt on the USGS. However, the watershed above Dixon is very impermeable and could behave more like AZ than NM. I think the true value is probably somewhere in-between the field and USGS values.
This line is probably as close as any to Bankfull:
Most plants that cannot tolerate saturated soil conditions for days at a time, like Alders, will not grow below BF, while willows and cottonwood can. Also, the top of point or side bars can indicate the height of BF, but on the Rio Embudo, near Dixon NM, BF indicators were contradictory and hard to find. Is BF just a few centimeters above the base-flow water, or are all the willow below BF?
![]() |
| From Rio Embudo at Dixon, NM Hydrology Analysis |
![]() |
| From Rio Embudo at Dixon, NM Hydrology Analysis |
TR-Upper
![]() |
| From Rio Embudo at Dixon, NM Hydrology Analysis |
TR-Middle
![]() |
| From Rio Embudo at Dixon, NM Hydrology Analysis |
Tr-Lower
![]() |
| From Rio Embudo at Dixon, NM Hydrology Analysis |
On each of these cross sections we marked where the current base flow water level is, where we think BF is, and where we think Flood Prone (FP) might be. To check these guesses, we correlated those heights with flow data from a USGS gauge just downstream:
![]() |
| From Rio Embudo at Dixon, NM Hydrology Analysis |
between the flow today and BF flow. To figure that out we might need to correct for any changes in the velocity (feet/second). Manning's Equation:
So it is a simple matter of geometry to calculate the cross-sectional area that would correspond to 400 CFS on our cross sections (red lines on the cross-sections, above). Without exception, this height is higher than our field-determined BF (green lines on the cross-sections, above) and, at least for TR-L, even higher than our FP height.
But is this right? Are we getting closer to the truth? To check, we can calibrate our answers for the Rio Embudo against data published by Natural Channel Design on a large number of other Southwestern rivers:
![]() |
| From Rio Embudo at Dixon, NM Hydrology Analysis |
This line is probably as close as any to Bankfull:
![]() |
| From Rio Embudo at Dixon, NM Hydrology Analysis |
Subscribe to:
Posts (Atom)