Sunday, September 21, 2014

Happy 50-Year Birthday, Wilderness!


This month marks the 50th anniversary of the Wilderness Act, and one of the best celebrations, or obituaries, was just written in Orion Magazine by Jordan Fisher Smith.

In the article, he lays out the fundamental contradiction inherent in the Wilderness Act:  that wilderness lands should be managed so as to preserve their natural character, while at the same time remaining untrammeled and uncontrolled for human uses.  But at Smith points out, using examples from endangered species preserveration, carnivore reintroduction, and invasive species control, wilderness areas cannot remain "natural" in the face of omnipresent anthropogenic changes.


So managers are forced to make tough decisions to maintain the biotic integrity of the land at the price of intervening in the land where "man is a visitor, and does not remain", or allowing massive changes to snowball out of control while sitting on their hands.  The real choices are hard enough, but the temptation to meddle is even tougher.


I very much appreciate the comment of T. R. Shankar Raman

If the idea of leaving wilderness alone is outdated, so is the idea that there is some hard boundary between the wilderness and the rest of the world ‘outside’. To use this idea to justify highly intrusive gardening of wilderness reserves distracts from a more vital need of fostering positive change in human land use and behaviour outside. It is more crucial to buffer harmful impacts to wilderness areas by greatly expanding the space for conservation outward into surrounding countryside and city. That, too, can ease the disturbance footprint, allowing wilderness areas to recover along their own trajectory with less and less intervention, until land and life are free, which ultimately, is what ‘wild’ really means. And it is in bringing down that boundary, looking outward from the wilderness, that we will perhaps find the way to rewild ourselves.

Monday, September 15, 2014

A streamlined, GIS version of USDA's Environmental Benefits Index

USDA calculates the environmental benefits of applying conservation easements to farmland.  The University of Minnesota has developed an online tool for mapping three important components used by decision-makers to prioritize farmland conservation funding:

Soil loss is calculated using the Universal Soil Loss Equation, which factors in slope angle and distance, soil texture,

Water quality risk was calculated using a Stream Power Index, and proximity of land parcels to streams.

Habitat quality was calculated using by intersecting known stressors such as roads and development with known areas of high quality habitat, such as areas with endemic or endangered species, high biodiversity, and/or high game abundance.

The combined metric for all three layers generates the Environmental Benefits Index.
Screenshot from maptool from the EBI page of the Natural Resources Research Institute at the University of Minnesota.


Environmental Benefits Assessments for USDA Conservation Reserve Program

The USDA uses an  Environmental Benefits Index (EBI) to rank Conservation Reserve Program land applications by prioritizing soil conservation, water quality, and wildlife habitat.  Six factors are considered:
  1. Wildlife habitat benefits resulting from covers on contract acreage 
  2. Water quality benefits from reduced erosion, runoff and leaching 
  3. On-farm benefits from reduced erosion 
  4. Benefits that will likely endure beyond the contract period 
  5. Air quality benefits from reduced wind erosion
  6. Cost
1.  Wildlife habitat is determined by looking at planting composition (introduced or native), number and composition of species (more species, and more functional groups such as legumes, shrubs, trees, forbs, and grasses have higher value), and landscape context (strips, blocks or mixtures that form corridors or gaps).  Points are also available for providing pollinator habitat and for enhancing wildlife in areas high-priority areas.

2.  Water quality benefits are determined by whether or not the property is in a designated surface water quality impairment zone, the type of soil, potential soil erosion, and distance to major waterbodies.

3.  Not discussed.

4.  Enduring benefits are determined subjectively based on the probability that conservation will continue beyond the CRP contract.  For example, trees would be expected to live longer than the 10-year CRP contract.

5.  Air quality benefits are determined by calculating potential wind erosion (based on average wind speed and soil texture), whether the property is in a air quality nonattainment area, and the potential to sequester carbon in the soil by planting trees, shrubs, or grass.

For more information, see the CRP Farm Science Administration website at USDA.gov.


....USDA also periodically reviews the effectiveness of their programs using the Conservation Effects Assessment Project.  Data and papers can be found here.


Monday, September 08, 2014

Organic Food Controversy in the New Yorker -- Science Writing at its Worst

Mr. Specter is a staff writer for the New Yorker.  He tends to write about agriculture and genetic engineering, but on closer inspection his writing provides a dangerous combination of blind faith in science and a misunderstanding of what science is.

His bio of Vandana Shiva uses a source to give voice to the conclusion that Shiva is “a fraud…blinded by her ideology and her political beliefs."  She responded alleging Specter's article made “fraudulent assertions" and consisted largely of "deliberate attempts to skew reality.”  The New Yorker's editor, David Remnick, defended Specter's article against her list of complaints, item-by-item.

But both Shiva and Specter make ideological arguments.  They both use convenient scientific anecdotes to support their "ideology and ...political beliefs".  However, Specter works as a "journalist," and therefore implicitly claims at least some objectivity, whereas Shiva is a self-described advocate for her cause, and is at least honest about her agenda.

Specter criticizes Shiva for being unscientific, but how scientific is Specter?  Does he cite scholarly papers?  No.  Does he weigh the pros and cons of conflicting theories?  No.  Instead, he interviews a couple scientists who happen to already agree with his perspective.

Do you ever wish that complicated issues could be quickly and easily resolved by an impartial and all-knowing 3rd party?  Specter has found just such an infallible arbiter, but, unfortunately for the rest of us, it a biased version of science.

Apparently, Specter thinks science is a set of facts that should not be questioned.  But science is just the inverse: a way of questioning that is based on facts (ie empirical evidence).  Specter is totally amazed that anyone could doubt “science”.  Even worse, he thinks he knows what “science” is!

(I've already pointed out the impossibility of some of the scientific assertions Specter has made in a previous blog post.)

I wrote this post because I noticed a pattern, or agenda, behind Specter's use of science.  He wrote an entire book defending science, entitled  "Denialism: How Irrational Thinking Hinders Scientific Progress, Harms the Planet, and Threatens Our Lives."  Specter's book claims to defend science and rationality from the assaults of organic food advocates, but he couldn't quite bring himself to evaluate the research that didn't support his conclusion. It's surprising how little actual scientific research he manages to cite; Tom Philpott had this to say about Denialism for Grist.org:

"Two major assumptions underlie [Specter's work]: organic agriculture delivers frightfully low yields, and GMO agriculture delivers reassuringly high yields. He doesn’t deliver data to back up either of those claims. Here are two studies, both of which came out in time for consideration in Denialism, that Specter really should have grappled with: 1) a 2009 study by the Union of Concerned Scientists showing that after decades of research, transgenic seeds have yet to deliver yield increases; and 2) a 2005 study in Bioscience (summary here) showing that yields of organically grown corn and soy match those of their conventional counterparts–with dramatically lower energy inputs."

For me, the real issue is a scientific question: can GMO crops sustainably out-produce other alternatives, particularly the organic small landholder polyculture that Shiva champions?  Shiva claims that local, diverse agricultural systems can produce more and healthier food per acre than green revolution mass monocultures, especially in the long run.  Unfortunately, while Specter's article questions some of Shiva's claims, it does little to fill this crucial knowledge gap.

Friday, September 05, 2014

Review of Soil Moisture Measurement Techniques


Advances in efficient, broad measurement of soil moisture are needed to understand plant stress response to drought.  Crop growth and phenology can be predicted (link) with accurate modeling of soil-plant-atmosphere interactions.  These dynamics are also crucial for advances in meteorology, since most rain that falls in the U.S. is recycled rain that has already fallen and evaporated at least once before, but often several times.  Accurate prediction of rainfall will continue to elude meteorologists until soil moisture can be measured and predicted.

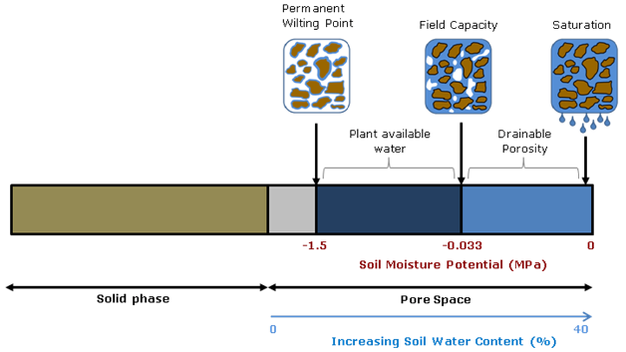
Soil moisture is critical for advancing plant and atmospheric sciences,  but the fact that different measurement techniques yield different values points to the fact that soil moisture is essentially an abstract idea.  While the water content of soil would seem to be straightforward, whether you calculate volumetric or gravimetric water content, and whether you consider chemically- and physically-immobilized water or only plant-available water (field capacity minus permanent wilting point) matters a great deal.


Diagram source.

Spatial and temporal scale also matters.  Do you want an instantaneous point measurement, or a daily weekly average for an entire county’s drought status?  Picking the right tool for the job means understanding the streghths and weaknesses of the entire gamut of technologies capable of reporting soil moisture.  This article will start with traditional in situ point measurement techniques and continue to review broad-scale soil moisture modeling and remote-sensing efforts.


from Shuttleworth 2013

Small-scale measurement can be accomplished using point-sampling with portable soil moisture probes, such as TDR and traditional (active) neutron probes.  Of course, any discussion of soil moisture measurement techniques would be incomplete without mentioning the gravimetric method, or simply weighing a soil sample wet and then dry.  But as with the other point techniques, this method can only measure hyperlocal conditions and must be replicated and averaged to inform landscape-scale management.

TDR, or time-domain reflectometry, uses the electrical properties of soil and water to calculate volumetric percent soil moisture.  For most soils, excluding those with very high organic matter (OM>10%), the TDR method without calibration provides water content in the range from zero to 50% with accuracy better than 1-2%.  While calibration and new TDR such as TRIME-TDR can improve accuracy by a factor of 10-100, the amount of microscale variability in soil means that these point measurements must be replicated dozens to hundreds of times to build up a picture of average site moisture. Microvariability can be important when precipitation preferentially flow along soil heterogeneities such as roots, textural changes, and bioturbation pathways.    Buried probes that use the TDR techniques, such as the Stevens Hydroprobes I used in my graduate research, are fixed in place and are therefore severely limited by their inability to average site variability.
  
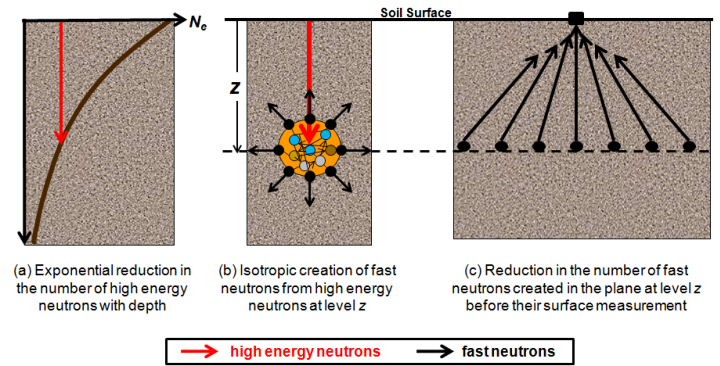
Traditional neutron probes work by bombarding the soil with high-energy neutrons and recording the number of neutrons emitted by the soil.  Hydrogen absorbs neutrons so the amount of H2O can be calculated.  This technique solves many of the problems of TDR, but the sensors are expensive and the measurement still must be repeated several times to measure field soil moisture.  

-

Meso-scale measurement can now be accomplished using the new COSMOS (Cosmic-ray Surface MOisture Sensor) program to measure whole ecosystem moisture.  Neutron moisture probes have been around for decades but COSMOS uses advances in particle-physics technology to increase sensitivity enough to rely solely on the background cosmic radiation as a uniform source of neutrons.  This advance makes possible, for the first time, instantaneous field-scale measurement of soil moisture.


These new sensors were originally deployed in 2010. They have the potential to revolutionize studies of soil moisture because they are the only technique to measure soil moisture at scales between the hyper-local point measurements and the kilometer-swaths of satellites.  They also are the only soil moisture probe that can account for water stores in living tissue.  According to Hydroinnova, one company that makes these $10,000 units, the measured soil footprint is 86% within 350 meters and the effective measuring depth changes with soil moisture, from a maximum of 70 cm in completely dry soil, to a minimum of 12 cm in saturated soil. 


Source.
While these sensors are few in number and relatively widely dispersed, they offer a whole new picture of soil moisture at the landscape level.  They are the only truly effective direct measure of soil moisture at the hectare level, and can be used to better calibrate the informational products discussed below.  However, as with all techniques, COSMOS must also be calibrated to take account of different soil types and changes in vegetation.

-

Large-scale measurement of soil moisture can be accomplished using proxies, satellites, models, or some combination of techniques.

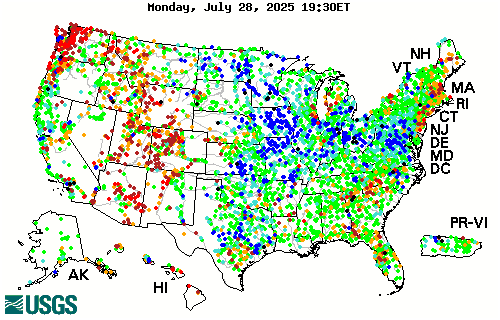
River flow data can reveal how much water is running off or through the soil from watersheds, so using a site like the USGSstreamflow network is a good proxy for large-scale short-term drought and deluge.


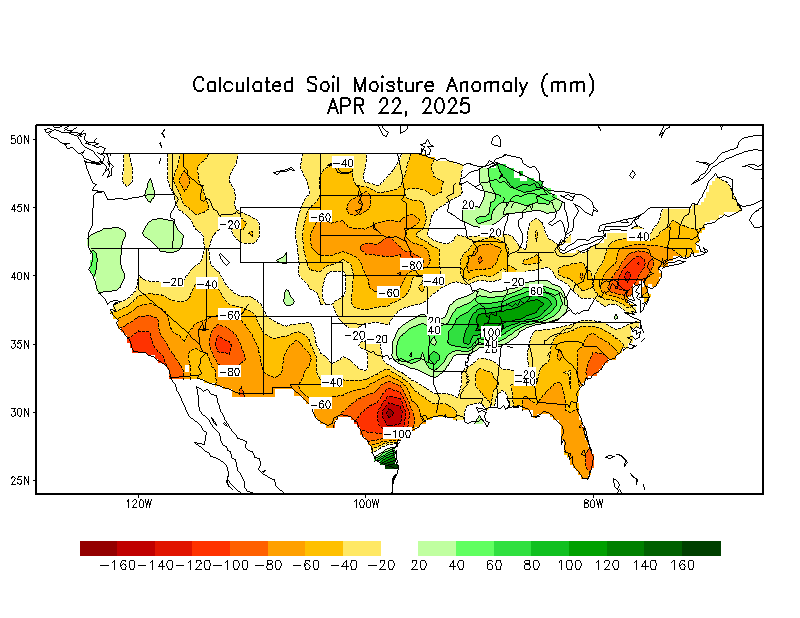
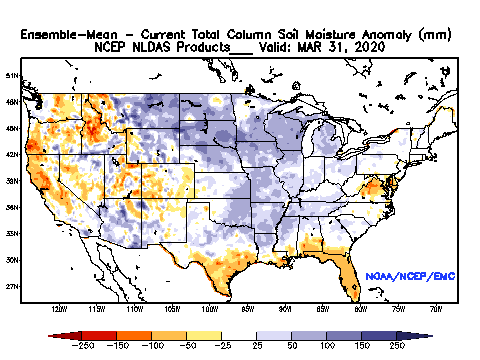
The current best methods for estimating large-scale soil moisture are the Drought.gov model products, which include the Palmer Drought Severity Index, soil moisture index, etc.  The Calculated Soil Moisture Anomaly is calculated based on observed precipitation and temperature.  Soil moisture, evaporation, and runoff for the entire US and globe are then modeled based on observations from a small area of eastern Oklahoma.  While this method is clearly biased, it is the best available.

The National Land Data Acquisition System is developing a more accurate model of soil moisture that incorporates soil textural properties and average percent vegetation (which impacts evapotranspiration).  The precipitation data used in the model is at approximately 25km resolution, interpolated to 13km grid cells:


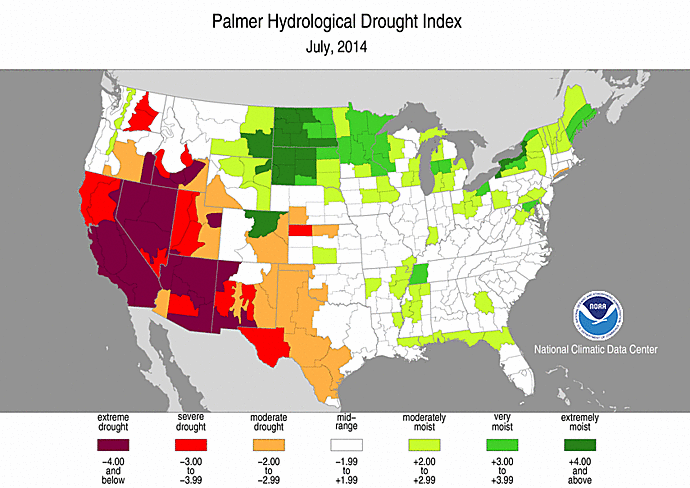
Palmer Drought Indices are similar to soil moisture models in that precipitation, evapotranspiration, and runoff are used to calculate remaining water balance.  There are long-term (Palmer Drought Index (PDI) and Palmer Hydrological Drought Index (PHDI) indices that measure changes in groundwater and reservoir levels, and short-term indices (Palmer Z Index and Crop Moisture Index (CMI)) that affect agriculture during the growing season.


 Interestingly, the US Drought Monitor, which looks essentially like one of the Palmer indices, is subjectively drawn using “a blend of science and subjectivity”.


Thursday, September 04, 2014

Problems Modeling Soil Moisture: Calculating Rainfall

All attempts to model soil moisture or drought condition use observed NEXRAD precipitation as inputs, but the raw data must first be corrected.

East of the Continental Divide, radar imagery is compared to ground rain gauges and a correction factor is calculated. In mountainous areas West of the Continental Divide, a different method is used to derive the "observed precipitation".  Ground rain gauge data is compared to average precipitation data (PRISM) and departures from that average are interpolated between gauge locations.  The end result is 4km resolution rainfall totals.  

Once observed precipitation is calculated, accumulated precipitation can be viewed for any time period using NOAA's website.


Clearly, 4km by 4km grid cells hide a great deal of local variability.  For example, the Rainlog network of rain gauges in Tucson records highly variable rainfall at locations less than a kilometer apart during the monsoons (W Miracle Mile is about 2 km):


Methodological problems in the way PRISM fills gaps using modeled historical data may bias against extreme or unusual rainfall patterns.  Also, numerous sources of bias in both the radar and the rain gauges have to be accounted for manually.  For example, radar can be biased by hail, angle, and artifacts created by birds and insects.  Rain gauges can also malfunction in an endless variety of ways, including sensor error, human error, and when ice and snow block the gauge.  These uncertainties in observed precipitation can jeopardize efforts to model soil moisture such as the PDI.  Also, they call into question research that has revealed an increase in extreme precipitation events.

Existing large-scale methods of modelling soil moisture are unconstrained by field measurements, so the advent of satellites offering weekly global measurements of soil moisture are an important step forward.  These satellites (such as SMOS) can image vast swaths of the Earth’s surface to infer average soil moisture at the surface, but this imagery has an accuracy of +/- 4% soil moisture over pixels that are 35-50 km on a side.  A new satellite launched this year (SMAP) has better resolution, approximately 9 km, but still nowhere near field-scale resolution.  Local hill slope, vegetation land cover, and soil texture differences mean that county-level averages aren't accurate enough to apply on individual acres.

There are some companies that claim to be able to remotely monitor acre-by-acre soil moisture for farmers, but that is not possible without field measurements.   

Wednesday, September 03, 2014

Smoke from Jemez Mountains Controlled Burn Impacts Albuquerque

The fire was caused by lightening in the foothills of the Jemez Mountains more than two weeks ago. Instead of suppressing the fire, managers have used the smoldering blaze to burn out undergrowth and unhealthy Ponderosa thickets. While the forest is moist enough to preclude any danger of catastrophic fire, that moisture may also increase the amount of smoke.


Last night smoke from the fire drained down the Jemez River valley and into the Albuquerque metro area. By this morning the smog was visible as a distinct haze in the valley. Clear skies and dry air probably helped establish an inversion that contained the smoke within the valley. The smoke quickly dissipated once daytime convection began.

ABQ Journal Photo
The Albuquerque branch of the National Weather Service noted that the "smoke event" this morning was "dense" and "impactful".  Some politicians have used the smoke to argue against this type of forest restoration.

 The NWS does not expect smoke to be as bad today as it was yesterday. But on a recent update to Inciweb, fire managers note that "hand and aerial ignitions will be used again today to direct the wildfire over an area similar in size to yesterday’s activity. Large columns of smoke from this ignition will be visible..."

Current air quality information can be found at http://www.nmenv.state.nm.us/aqb/PinoFireInformation.htm.


Tuesday, September 02, 2014

Ecology: More Work, Less Understanding

This year's Ecology Society of America (ESA) annual meeting featured a recent meta-review of scientific papers published over the last 80 years.  They found that the average number of statistical tests is increasing, but that the explanatory power (the amount of total variability explained) has decreased!
In-depth coverage can be found at Ahmedelazab.

Monday, August 25, 2014

Good Monsoons so far in New Mexico!

Almost the end of August and the climatological "monsoon" in the Southwest should be wrapping up around the first or second week of September. The last two months of rains have been sporadic, but significantly above average in the Land of Enchantment. Most areas in central NM are above 150% of normal for the season, and there are many areas that have tripled their average summer rainfall!

Thursday, April 17, 2014

Water-year to Date Departure from Normal


The area East of Carlsbad, NM in Eddy county going into Lea county has had 2-4 or even 6 inches more rain than normal since October 1st.  The figure above shows that this is almost triple the normal precipitation in places. The mesquite is bright green and there are many flowers, despite below-freezing temperatures at the beginning of the week.  A good place for some springtime botany!