Wednesday, October 05, 2022

Biodiversity Phenology

 There are many ways to explore biodiversity using iNaturalist.  One way to study the biodiversity of a geographic area is with phenology:  the science of when things happen.


For example, it is possible to modify the search URL to find observations of plants within 100 km of Dublin, OH, to search for specific months.  The count of observations for each species give some idea of their abundance in that month.


Central Ohio's most common flowering plants in March.

Central Ohio's most common flowering plants in April.

It is interesting to note that the number of observations for e.g. Bloodroot (Sanguinaria canadensis) increase from March to April, but its relative abundance appears to decrease as Dutchman's Breeches (Dicentra cucullaria), Trout Lilies (Erythronium americanum) and other species are photographed much more in April.

Sunday, September 25, 2022

Where is most biodiverse?

 iNaturalist can be used to compare biodiversity in different locations.  

To do this, it is important to allow for different search effort in different areas: for example, a search of the middle of the Amazon might not return many species, not because there aren't many, but because people haven't observed them.

For the U.S., we will assume that search effort is at least somewhat comparable.  We will also look at total observations and divide them by total species to get some idea of the effort required to document a new species in that area.

We decided to investigate my home town in Washington State, Alexandra's home town in Ohio, one of our favorite places: Maui, and our current home in Arizona.

Port Orchard, WA

A 100 km search radius includes most of Puget Sound, the Olympic mountains, and Seattle.

Dublin, OH

A 100 km search radius includes most of central Ohio creeks, woodlands, agricultural lands, and all of Columbus OH.

Prescott, AZ

A 100 km search radius includes canyons and mountains between Flagstaff and Phoenix.


Maui, HI

A 100 km search radius includes all of Maui as well as ocean channels and nearby islands.


Summary Table


According to this analysis, Washington is most biodiverse, followed by Ohio, then Arizona, and in last place is the island paradise of Maui.  

Island biogeography teaches that islands, although unique for their level of endemic plants and animals, should be deficient in overall biodiversity if there hasn't been enough time for biodiverse taxa to colonize or evolve on the island.  This seems to be the case with Maui, which is especially depauperate in insects, given its tropical location.

Arizona, despite its diverse environments, is significantly lacking in Fungal diversity, which could be due to the arid climate.

The American Midwest, with its perfect seasonal growing climate, is remarkably biodiverse, and would probably surpass Washington if this search had included a more varied part of the Midwest with more mountains and/or rivers and lakes.

Washington tops the list as most biodiverse, probably because of the presence of diverse environments, with everything from alpine mountain tops to ocean kelp forests, and everything in between.  This is despite the lower number of insect species compared to a lower latitude place like Ohio.

A caveat to this entire analysis is revealed by the Total Observations in each area and the resulting Observations per Species.  While I had assumed that search effort would be equivalent across the US, it is evident that many more people are using iNaturalist around major cities like Seattle and Columbus.  Arizona is more sparsely populated and has many less observations, and Maui, despite the huge numbers of tourists, is even less populated.  This means that is only takes 20 or 27 new observations (on average) to observe a new species in Maui and Arizona, respectively, while it takes 47 or 72 new observations in Ohio and Washington, respectively, to observe a new species.  So even though Washington has the most observed biodiversity in iNaturalist, it may be easier to find new, previously-unobserved biodiversity in Maui or Arizona.


Thursday, September 22, 2022

Mapping Species Habitat with Appropriate-Sized Buffers

 Previously, I wrote that this Story Map shows small polygons of habitat as buffers around representative observations.  However, the actual locations are not accurate because the underlying observation data has been randomized to protect populations of rare species. 


The first map ("Preliminary Conservation Zones" and "Potential Dispersal Zones" for the American, Rusty-patched, Suckley's, and Western bumble bees) shows the correct kind of critical habitat (buffered observations) USFWS has designated for rusty patch and would likely designate for other proposed species, but the locations are incorrect.  For example, the mapped locations of Rusty patch on that map do not line up to the USFWS GIS for rusty patch critical habitat. 


Some of the other species may be are incorrect as well, depending on whether the data source (GBIF) considers the species endangered and so randomized the locations within a 0.2 degree lat/long box.  That seems to be the case for the Western Bumble bee, but not the American bumble bee. 


The map shows a mix of accurate and inaccurate, specific habitat points. This is confusing and potentially misleading, if the intent is to facilitate conservation planning.  For example, when I zoom to an area of interest, I might think there is no mapped habitat there. But if there is some nearby, I can't tell from if that habitat is or isn’t within my area of interest.


The easiest fix would be to increase the size of the buffers so that they include the entire randomized area (0.2 degree, lat/long) that each point comes from.  A note could say that critical habitat would likely be designated in a subset of those larger polygons based on the buffer size USFWS decides.

Monday, September 19, 2022

Rusty Patched Bumble Bee Critical Habitat


Rusty patched bumble bee range map.

USFWS listed the rusty patched bumble bee (Bombus affinis) as Endangered in 2017 due to a marked decrease in the range and size of populations across the Eastern U.S.  

As one of the first insect species to be listed under the Endangered Species Act, it offers an interesting case study for the way USFWS may approach other insects proposed for listing, including the Monarch butterfly, and numerous other bumble bee species.

From Xerces Society Listing Petition, 2016.

The listing petition states that "the rusty patched bumble bee probably needs floral resources to be located in relative close proximity to its nest sites, as studies of other bumble bee species indicate that they routinely forage within less than one kilometer from their nests ... although in some cases nearly two kilometers ... [It] is likely dependent upon woodland spring ephemeral flowers, since this bumble bee emerges early in the year and is associated with woodland habitats.....Rusty patched bumble bee queens are one of the earliest species to emerge, with observations as early as March and April."

Interestingly, rather than designate critical habitat based on the habitat needs of the species, USFWS chose to designate "High Potential" zones (e.g. critical habitat) as 1 mile buffers, and "Low Potential" zones as 4 mile buffers, around known (since 2006) sightings of the rusty patched bumble bee:


USFWS Map showing "High Potential" and "Low Potential" zones.  


Detail showing example 2x2 mile rusty patched bumble bee "High Priority" habitat in DeKalb, IL from USFWS map.  The buffered area seems to be based on a sighting at Prairie Park, and includes residential and industrial developments.  The only habitat in the area is within Prairie Park.  


USFWS has issued the guidance on whether consultation is required.  For vegetation management activities within the High Potential zones, the guidance provides the following test questions:
  • Is there habitat for nesting, foraging, and/or overwintering for the rusty patched bumble bee in the action area or will the proposed action restore habitat for the species in the action area? 
  • Will the action cause effects to vegetation in rusty patched bumble bee habitat in the High Potential Zone during the nesting period? Effects could occur as a result of mowing, cutting, grazing, prescribed fire, tree removal, spot-application of herbicide, tree clearing, and/or other activities. 

Based on this case example, it seems likely that USFWS will take a similar approach when listing other bumble bee species.  Specifically, it seems likely USFWS will only designate habitat immediately surrounding recently documented sightings, as opposed to using a general habitat model across the species' range.  Then, Section 7 consultation will be required for any activities that disturb habitat during the nesting period (i.e. growing season).

This seems to be the assumption underlying this Story Map, which shows small polygons of habitat as buffers around representative observations.  Note that the actual locations in this map are not accurate because the underlying observation data has been randomized to protect populations of rare species. 

This map of rusty patched bumble bee habitat around DeKalb, IL schematically shows the kind of habitat USFWS designated (i.e. buffered polygons around point observations) but does not show the accurate locations of the habitat because the data used for the map (GBIF) is randomized within 0.2 by 0.2 latitude/longitude rectangles.  

Thursday, September 15, 2022

Mitigation Banking Could Transform the Endangered Species Act

 The Clean Water Act (CWA) --despite its ambiguities-- has the important provision of acre-for-acre wetland mitigation. In other words, the CWA ensures No Net Loss of protected wetlands.

The Endangered Species Act (ESA) --despite controversies over Critical Habitat-- has no automatic provision of no net loss of protected species habitats. Instead, it relies on bespoke mitigations on a project-by-project basis. Most projects are approved with incompletely mitigated impacts to species and their habitats. The result is continual loss of habitat.

Current proposed changes to habitat mitigation could help make ESA more like CWA, moving the ESA toward No Net Loss of habitat. The result would be improved regulatory certainty for projects, mitigation banking opportunities for conservation investors, and better outcomes for listed species.

Environmental Policy Innovation Center's Becca Madsen has more excellent & detailed analysis.

Monday, September 12, 2022

Thistle Misidentification

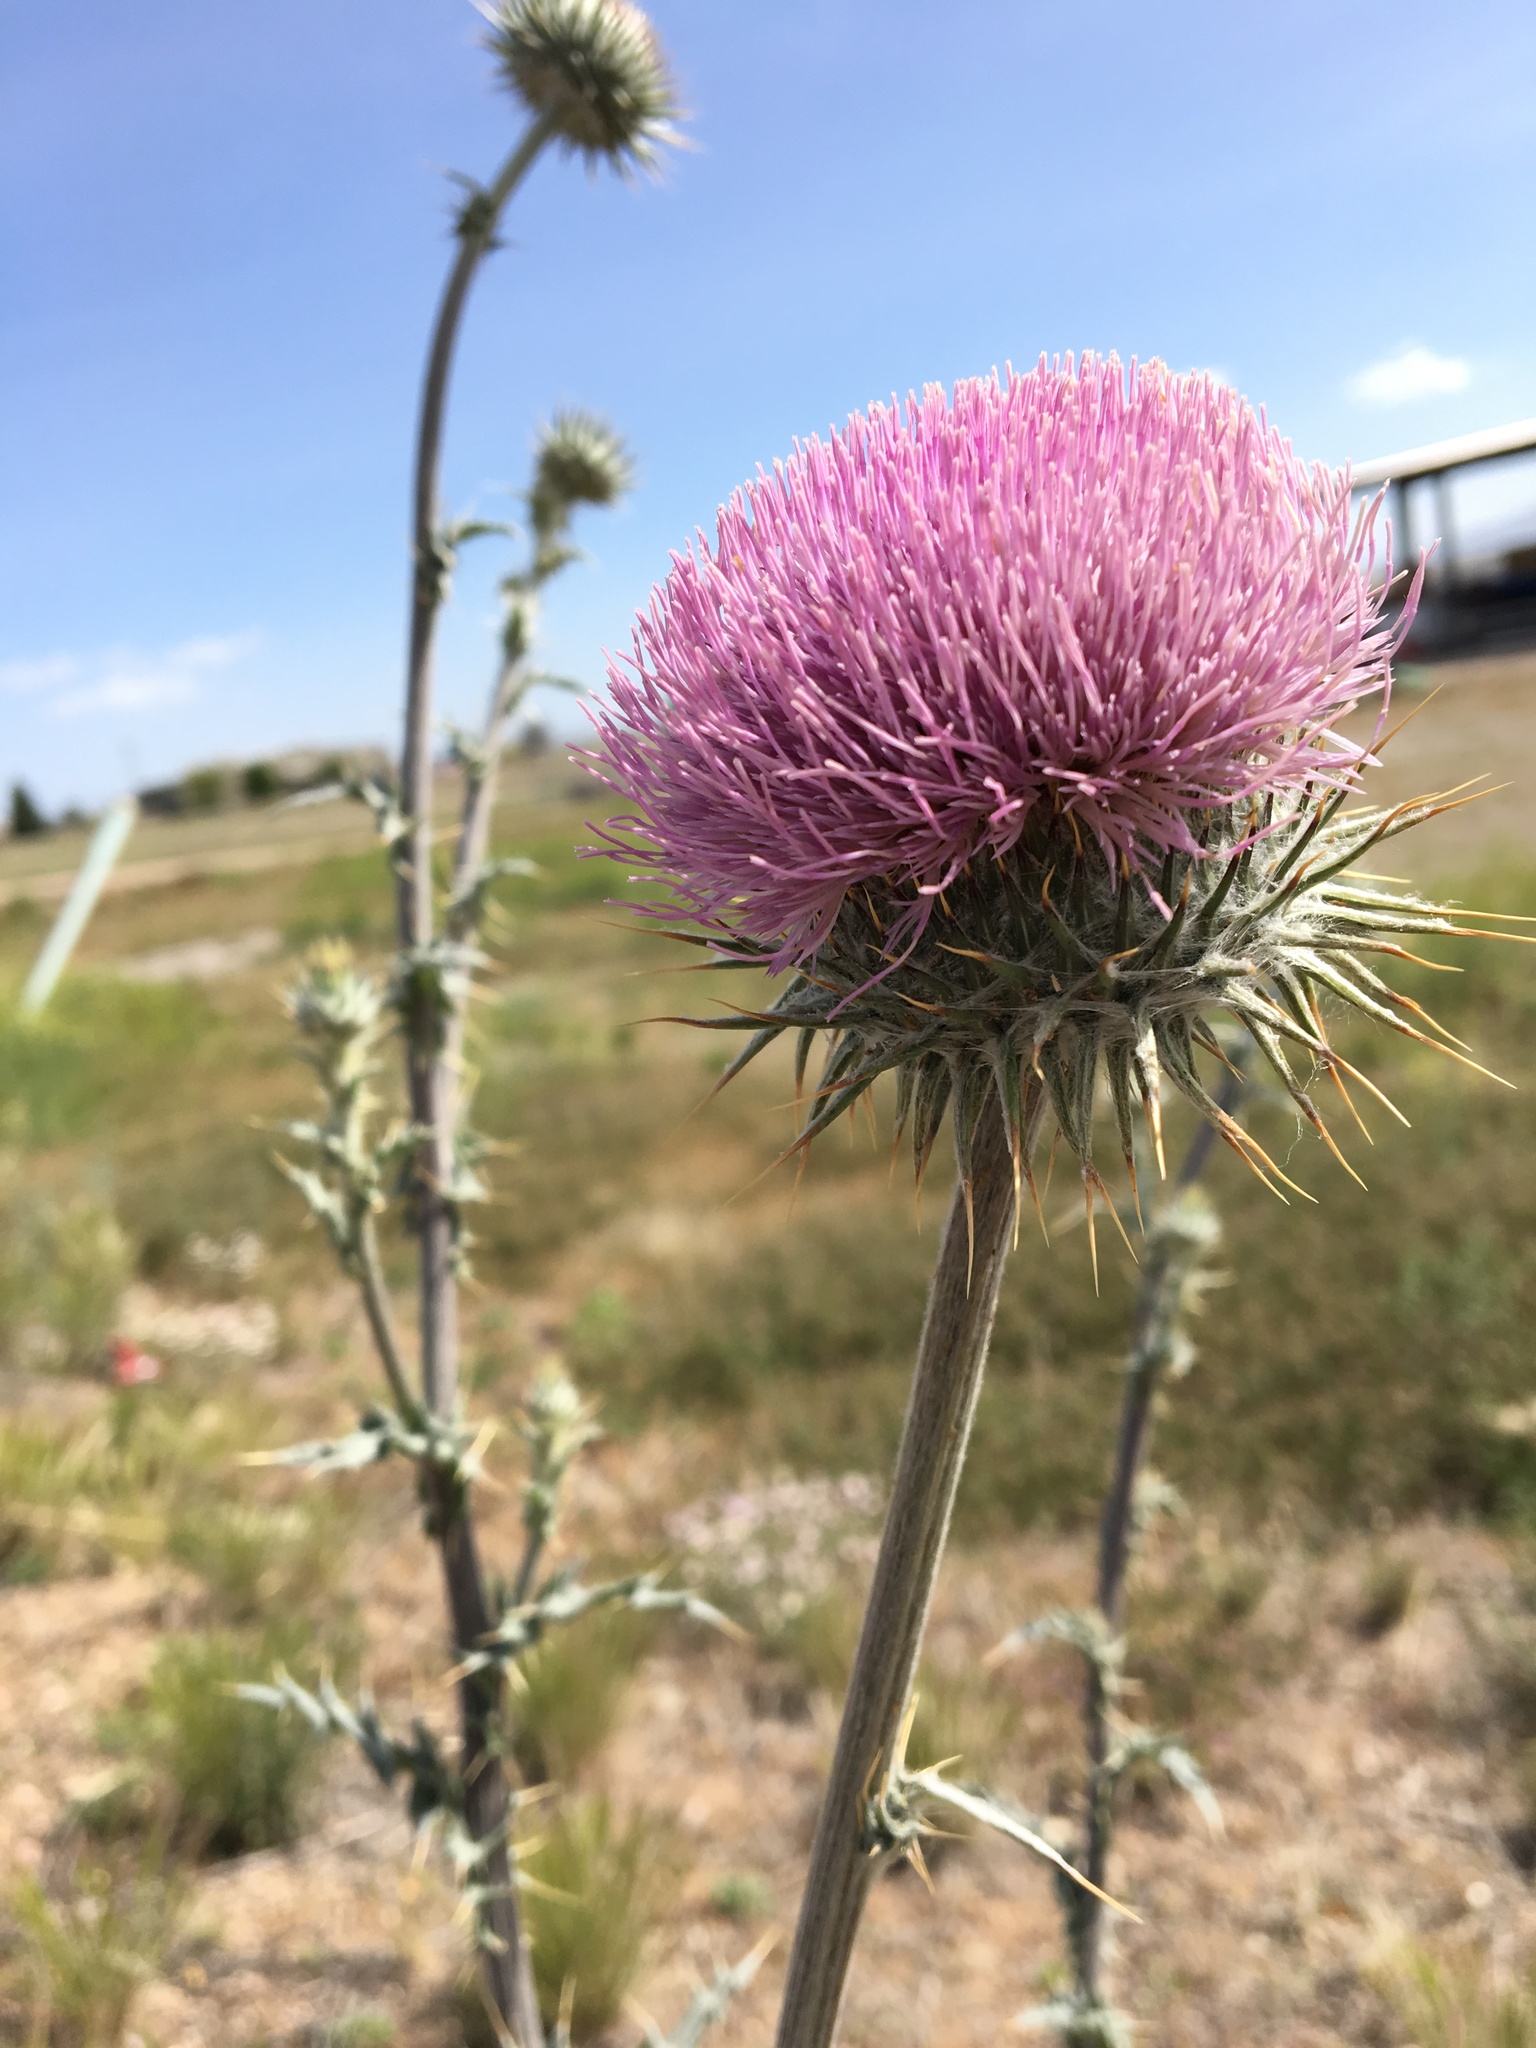
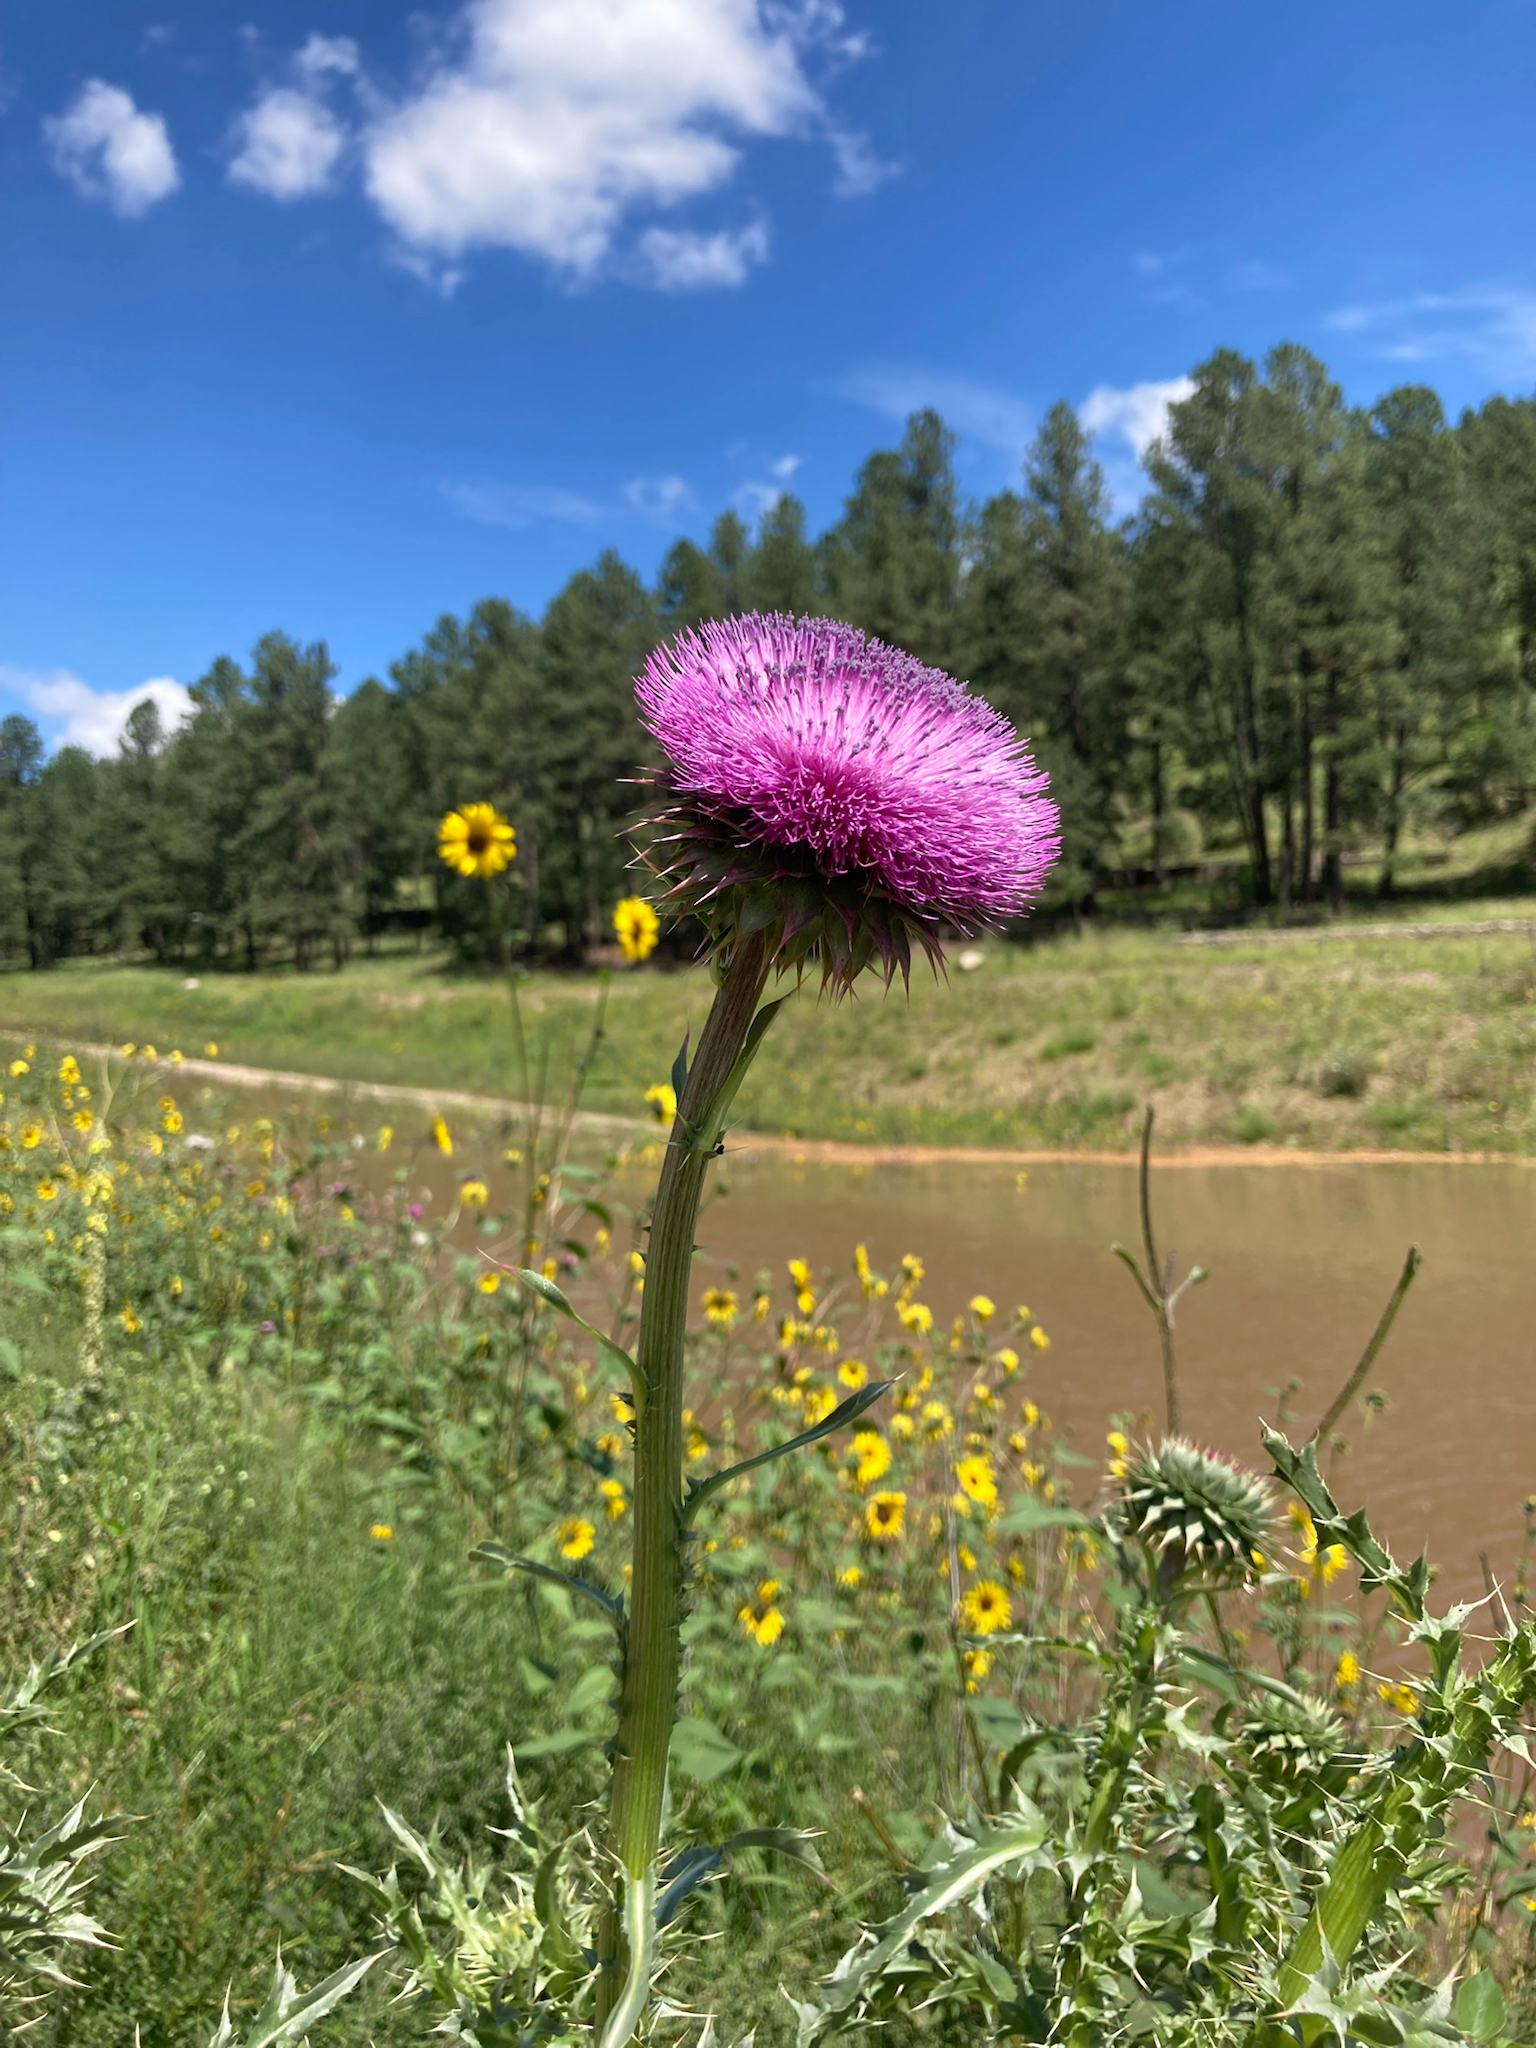
Thistles are amazing flowers, but there are both native and nonnative invasive species in the Western US.  Some people who try to do good by removing nonnative thistles accidentally kill the native species as well. 

NM Thistle, Cirsium neomexicanum. My photo on iNaturalist. Link: https://www.inaturalist.org/observations/15024423

I worked with an AmeriCorps crew in the Sacramento Mountains (Lincoln NF) that had been removing musk thistles.  But I found out they didn’t know how to tell the difference between native and invasive thistles. 

Photo of musk thistle Carduus nutans from iNaturalist user c-guinan. Link: https://www.inaturalist.org/observations/132367683

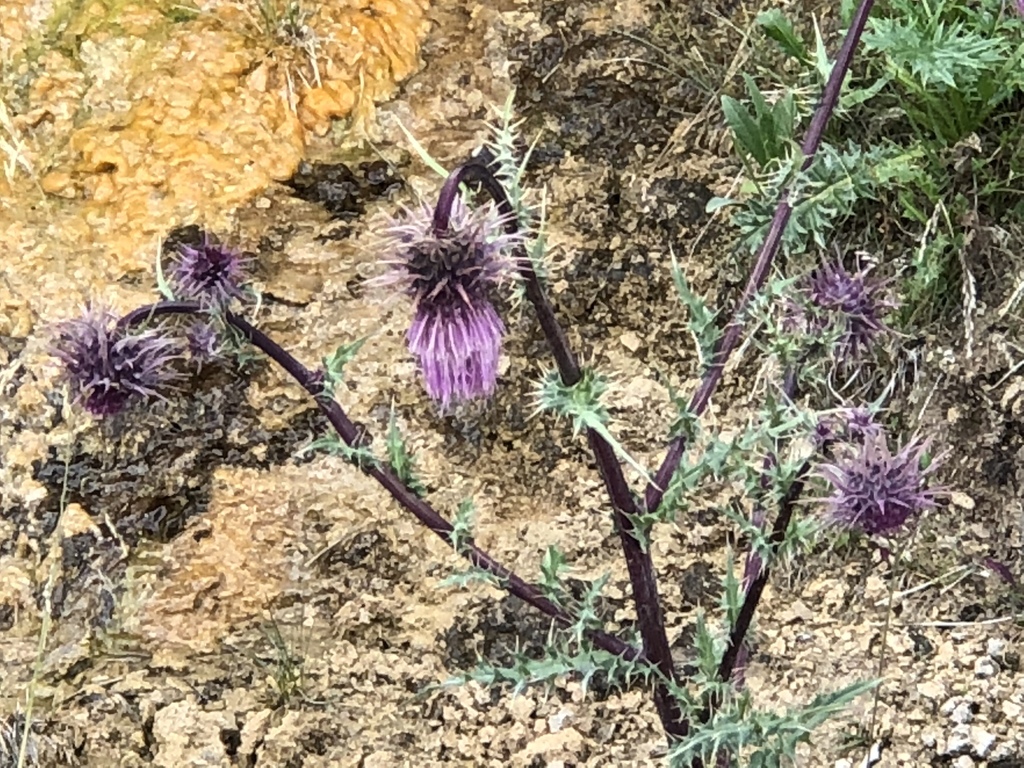
Even worse, they didn’t even know that there is an Endangered species of native thistle in those mountains!  We investigated and it looks like they at least didn’t kill any endangered thistles, but it could have been really bad. 


Photo of Endangered Sacremento Mountains Thistle Cirsium vinaceum from iNaturalist user ck2az.  Link: https://www.inaturalist.org/observations/14433149

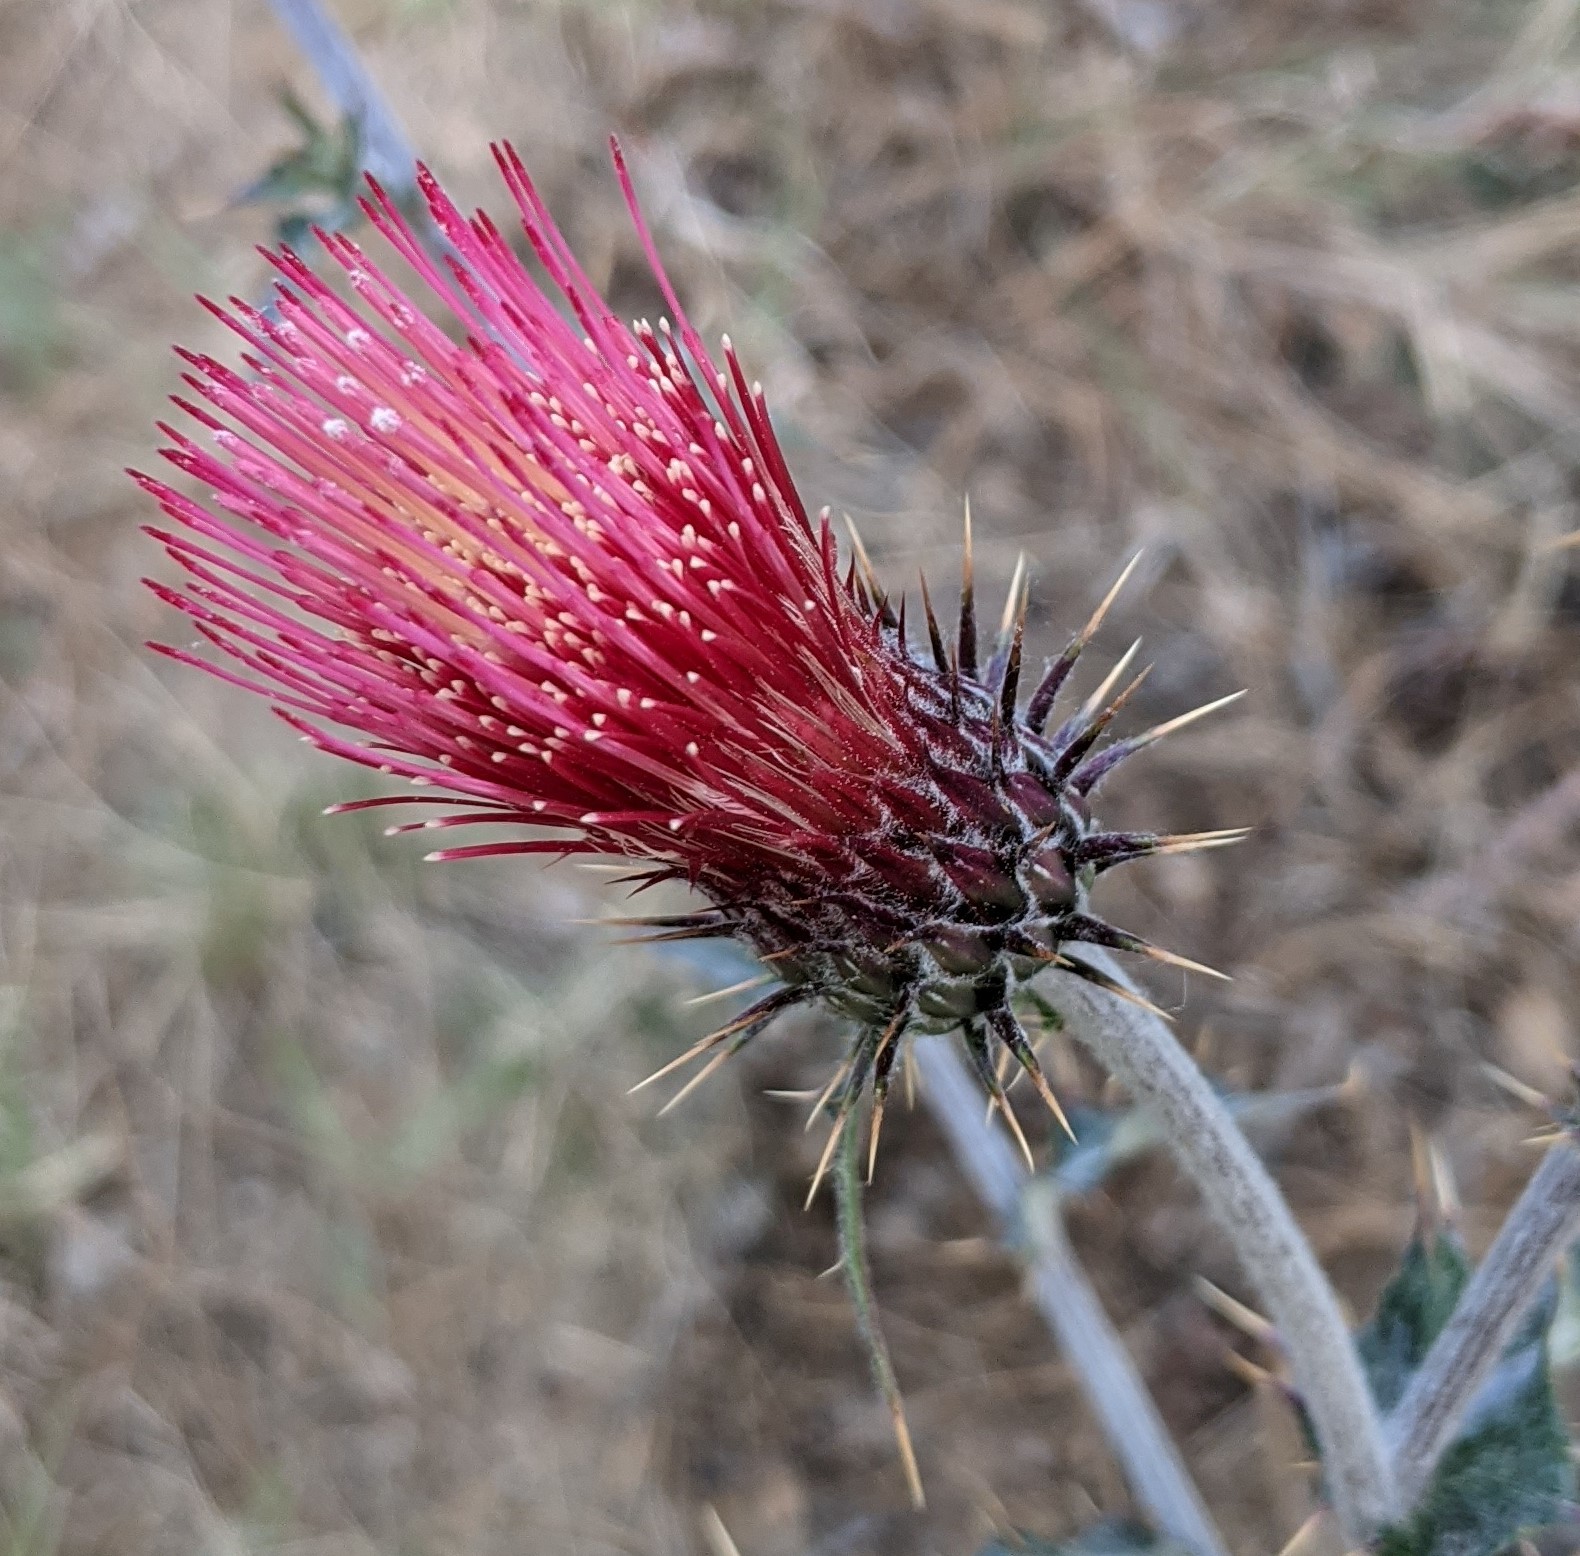
I’m currently trying to find the volunteers on the Prescott national forest who are pulling up all of the Arizona thistle along popular trails.  Its especially troubling to me when people who are trying to do good by removing invasive species end up destroying native species.

Arizona Thistle Cirsium arizonicum.  My photo on iNaturalist.  Link:  https://www.inaturalist.org/observations/87880049

Everyone who’s done natural resource work has stories of project missteps.  I don’t know how to prevent all mishaps, but talking about these misidentifications is a good first step.

The NM Native Plant Society has a great Thistle ID book written by Bob Sivinski.

Tuesday, August 16, 2022

Renewable Energy's Blind Spot

The Environmental Risks and Opportunities at Solar Sites

In its Clean Energy Commitment, APS laid out a path that includes tripling the renewable energy provided to customers in the next 10 years. Much of that goal will come from large solar sites in the Arizona desert. But what about the environmental, sustainability and governance (ESG) impact of those megawatts?


It may seem counterintuitive to ask about ESG for solar, since renewable energy is considered good for the environment. But utility scale solar sites, like other large developments, can have negative environmental effects depending on how they are sited and maintained.


Rapid renewable buildout without careful siting and maintenance can harm sensitive environments and community relationships.  ESG issues at solar sites may be a blind spot when company metrics are focused on total renewable or clean energy without a biodiversity component. 


Siting


The Arizona desert has areas of high biodiversity that should be avoided during development of renewable energy. Although all projects receive some environmental review, the level of review depends on the landowners, regulators and companies involved. This regulatory patchwork means that projects can be approved while still having significant issues.


For example, a large solar project in California was approved in prime desert tortoise habitat, and the company involved spent at least $56 million relocating the threatened species from its solar site. A different species of desert tortoise lives in AZ, but resource managers here are also concerned about impacts from development.


AZ Game and Fish (AZGFD), in their Guidelines For Solar Development in AZ, call for avoiding areas of high biodiversity, with a preference for already-degraded sites. By using land that has already been impacted by farming or mining, utility solar development can avoid many of the environmental risks associated with building on pristine landscapes.


Maintenance


Solar sites in the desert are usually maintained as bare ground, which involves regular application of herbicides to control any sprouting vegetation. Unfortunately, bare ground can concentrate and channel water, leading to runoff, erosion, and water pollution. And when it doesn’t rain, dust from the bare ground can lower air quality and soil the solar panels, reducing their efficiency.


The AZGFD Guidelines call for native plant revegetation of areas not necessary for facility maintenance. Revegetating parts of the sites with native plant species provides valuable habitat for pollinators and other native flora and fauna. AZGF notes that revegetation can also help control or prevent erosion, siltation and air pollution by stabilizing soil surfaces.


Challenge as Opportunity


The International Union for Conservation of Nature (IUCN) states that “solar developments can demonstrate good environmental stewardship through conservation and rehabilitation of local biodiversity.”


Across the US, solar sites are increasingly evaluated for overall sustainability, including impact to biodiversity. For example, 15 US states have already created environmental scorecards for solar energy sites. Sites with native vegetation that benefits pollinators and other species are rated higher.


Including best management practices (BMPs) in the siting and maintenance of solar sites, such as those in AZGFD Guidelines, can help ensure that solar sites don’t contribute to environmental degradation and are part of the environmental solution they are intended to be.


By proactively addressing these challenges, utilities can show commitment to ESG values while reducing potential conflicts and costs.


Further reading:


https://forestpolicypub.com/2022/08/08/now-comes-the-hard-part-of-the-ira-the-problems-of-siting-wind-and-solar-by-sammy-roth-of-la-times/

Tuesday, April 05, 2022

Aerobic Threshold or How to Estimate Metabolism with the Breath

All text and images from Alan Couzens.

The #AerobicThreshold or first rise in the lactate curve is a key training intensity. 

Primarily because it usually coincides with the highest rates of #FatBurning coupled with relatively low CHO oxidation, so the athlete can accrue a lot of work with minimal metabolic fatigue.

VE = ventillatory efficiency, or how deeply you breathe.  RR = respiration rate.

As the chart above shows, when an athlete begins a progressive metabolic test their VO2 (oxygen) requirements increase almost immediately & in fairly direct proportion to the exercise intensity. It makes sense then that we'd have to increase our breathing to match this, right?

Wrong!

Our body is pretty wasteful with O2 at rest. Our muscles don't take up most of the O2 in the blood & it just cycles around. Therefore, the first port of call when our body needs more O2 is simply for the muscles to take up more already circulating O2 from the blood...

This shows up as an increase in the a-VO2 difference, i.e. the *arterio* *venous* *oxygen* *difference* - the difference between the amount of O2 in the blood of our arteries going into the muscle & our veins coming out...


https://twitter.com/alan_couzens/status/1488891134466084864?s=21&t=GfrF4HO0hBGxSZfFjVoy8g


As we continue to increase the intensity of exercise after moving from nose breathing to quiet mouth breathing, eventually we encounter a second breakpoint in ventilation - the transition from quiet mouth breathing to loud mouth breathing...


This shows up as an increase in the a-VO2 difference, i.e. the *arterio* *venous* *oxygen* *difference* - the difference between the amount of O2 in the blood of our arteries going into the muscle & our veins coming out...

At this point, metabolic acidosis is starting to increase and the body's response to it is to "blow off" the increasing carbonic acid in the form of additional CO2...


This is directly visible in the relationship between VCO2 (the amount of carbon dioxide being produced) vs VO2 (the amount of Oxygen being consumed). At this point in the test the CO2 line takes a turn & begins approaching the O2 line.


https://twitter.com/alan_couzens/status/1489260556934471681?s=21&t=GfrF4HO0hBGxSZfFjVoy8g


Development of Diabetes

Everyone is on the spectrum….


Source:   https://link.springer.com/article/10.1007/s00125-021-05505-4


Tuesday, January 11, 2022

Phenology, Accumulated Growing Degree Days, and Soil Moisture

US Crop Calendar

Source: https://ipad.fas.usda.gov/countrysummary/Default.aspx?id=US


Arizona had a good year for NDVI

Source: https://glam1.gsfc.nasa.gov/


NASA SMAP data.  Data is global.


This mapped layer is delayed by 2 weeks.  I haven't found a layer that shows real-time moisture.


NPN Visualization tool can view Historical, Current, and Anomaly Accumulated Growing Degree Days. Data is only for USA.

Source: https://data.usanpn.org/vis-tool/#/explore-phenological-findings