Thursday, September 15, 2022

Mitigation Banking Could Transform the Endangered Species Act

 The Clean Water Act (CWA) --despite its ambiguities-- has the important provision of acre-for-acre wetland mitigation. In other words, the CWA ensures No Net Loss of protected wetlands.

The Endangered Species Act (ESA) --despite controversies over Critical Habitat-- has no automatic provision of no net loss of protected species habitats. Instead, it relies on bespoke mitigations on a project-by-project basis. Most projects are approved with incompletely mitigated impacts to species and their habitats. The result is continual loss of habitat.

Current proposed changes to habitat mitigation could help make ESA more like CWA, moving the ESA toward No Net Loss of habitat. The result would be improved regulatory certainty for projects, mitigation banking opportunities for conservation investors, and better outcomes for listed species.

Environmental Policy Innovation Center's Becca Madsen has more excellent & detailed analysis.

Monday, September 12, 2022

Thistle Misidentification

Thistles are amazing flowers, but there are both native and nonnative invasive species in the Western US.  Some people who try to do good by removing nonnative thistles accidentally kill the native species as well. 

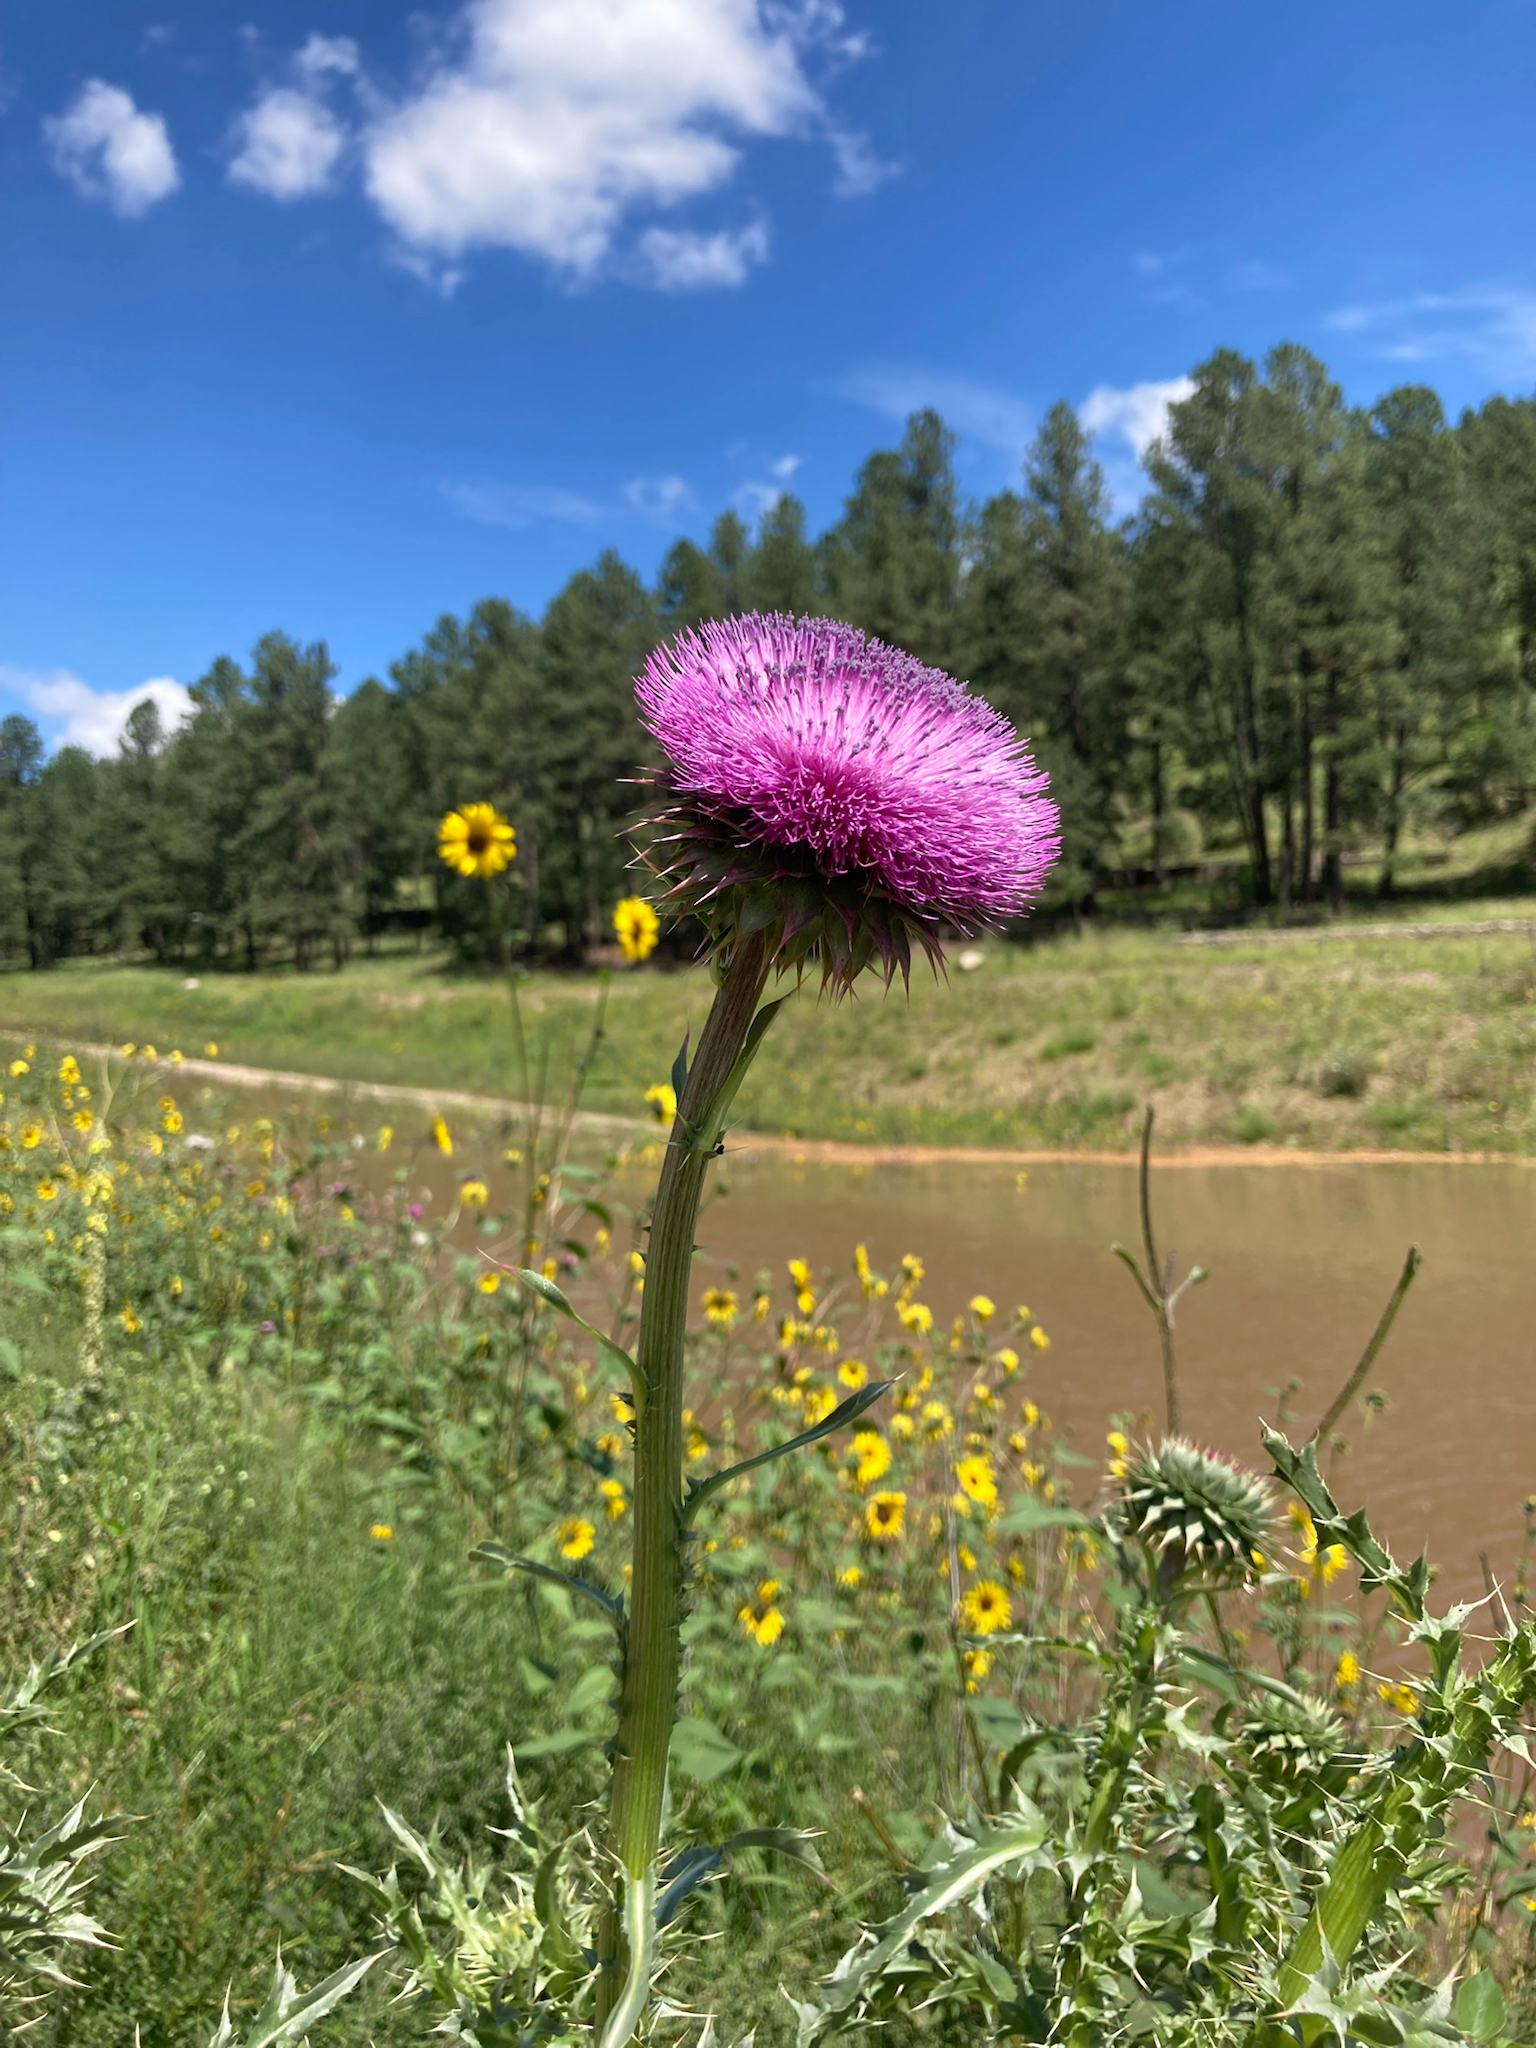
NM Thistle, Cirsium neomexicanum. My photo on iNaturalist. Link: https://www.inaturalist.org/observations/15024423

I worked with an AmeriCorps crew in the Sacramento Mountains (Lincoln NF) that had been removing musk thistles.  But I found out they didn’t know how to tell the difference between native and invasive thistles. 

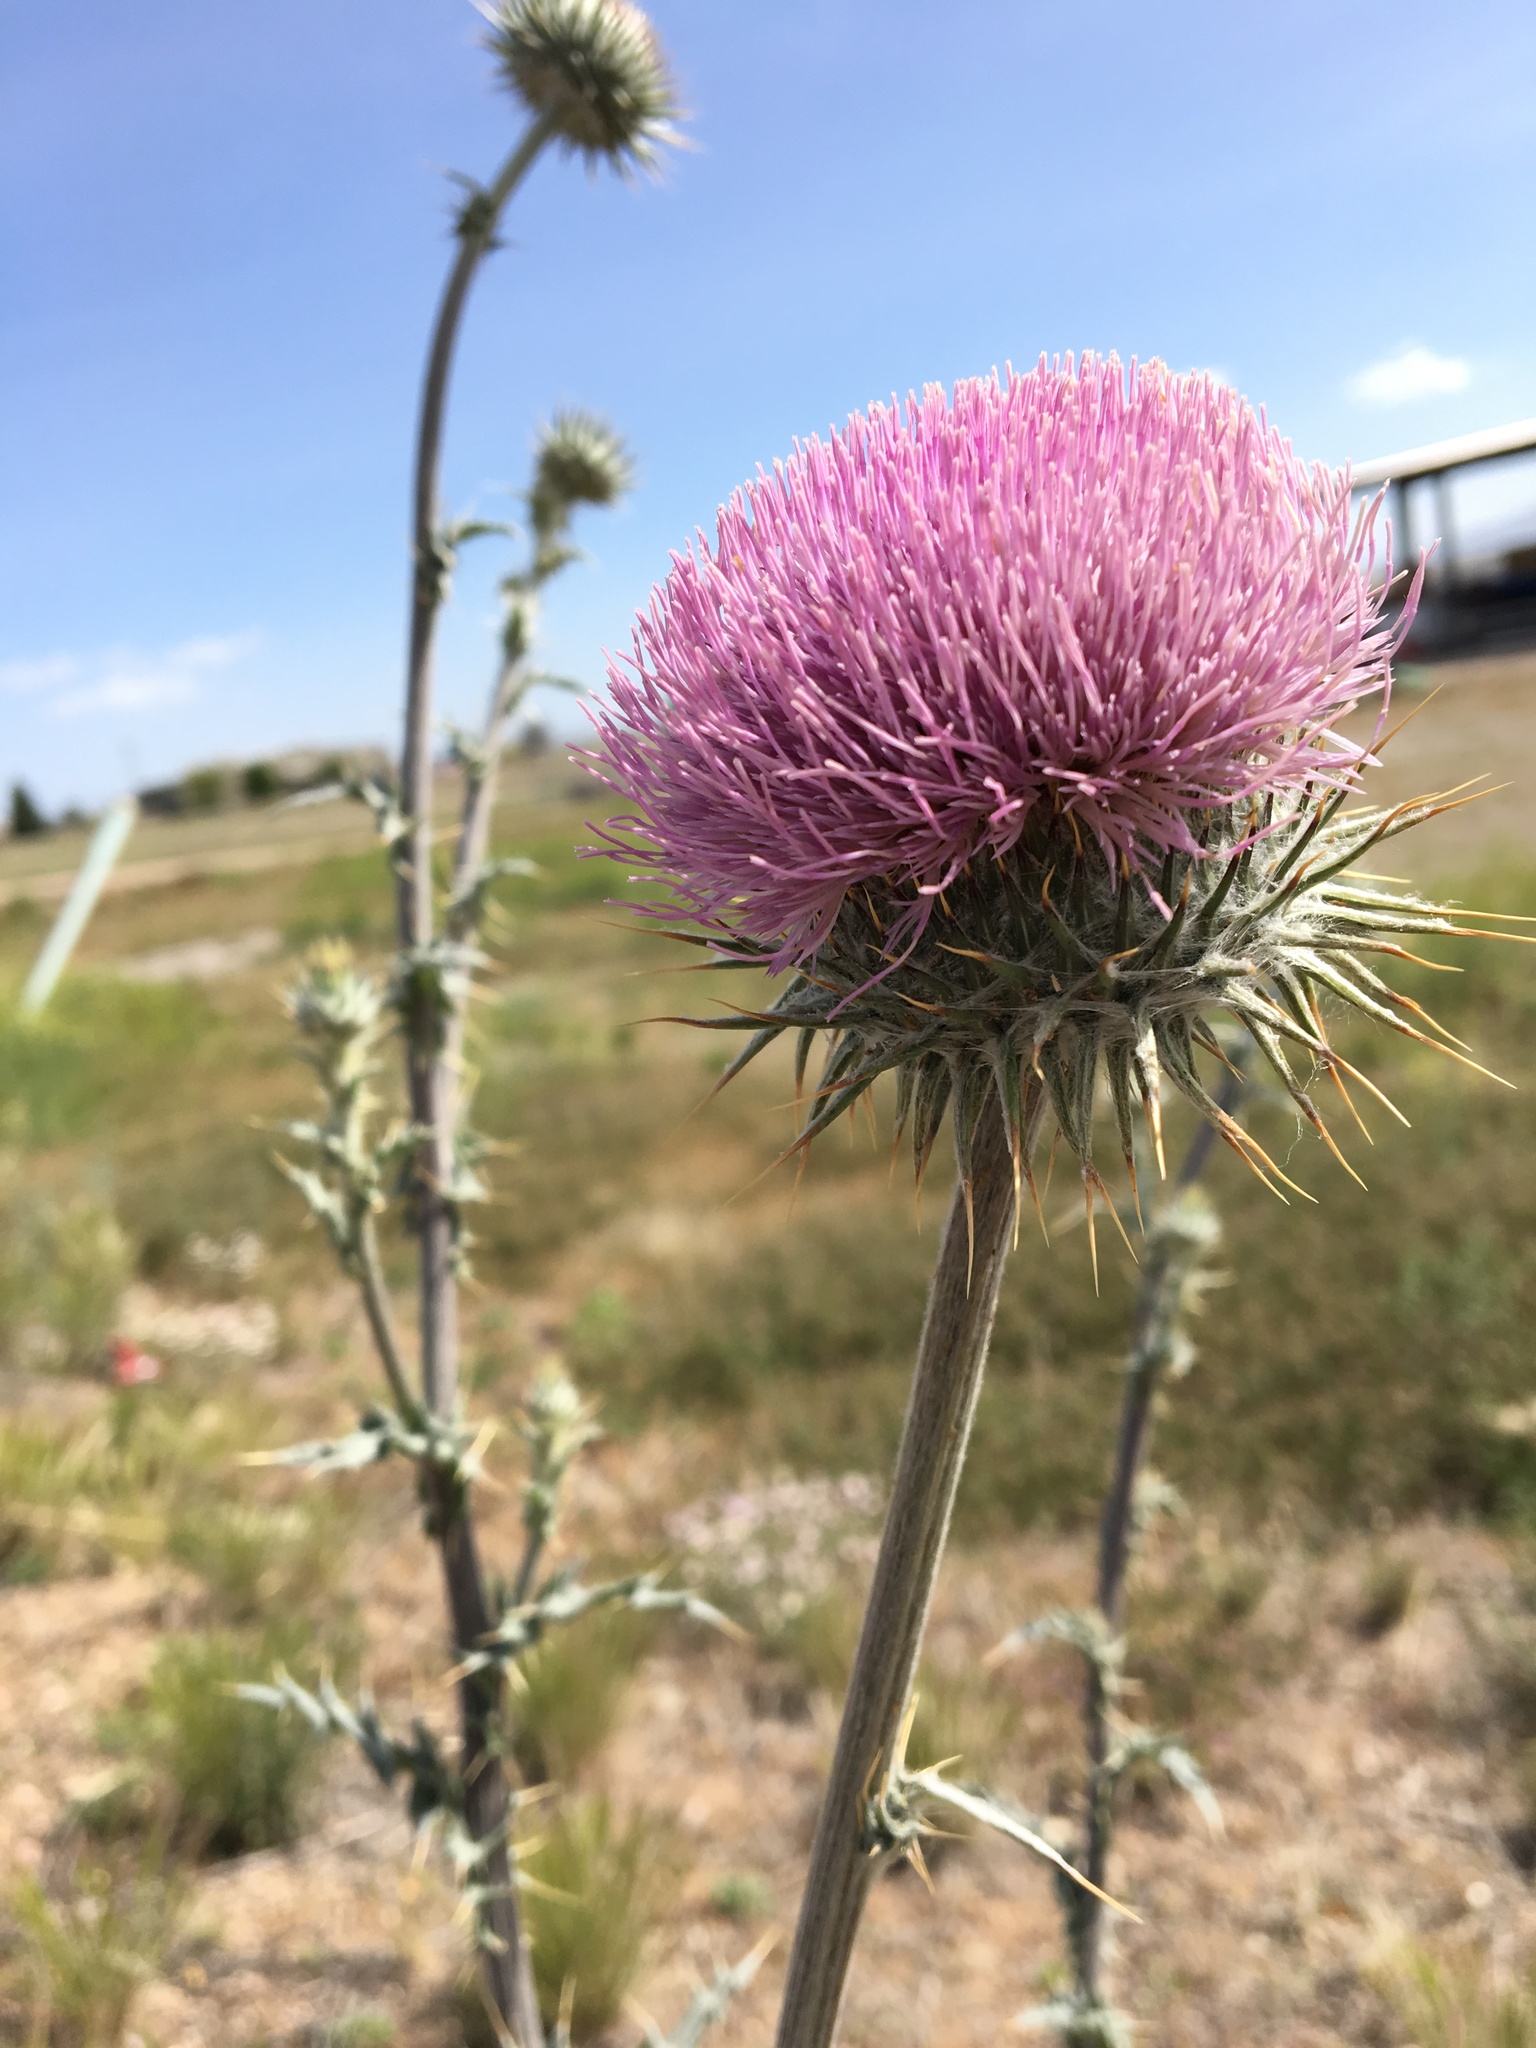
Photo of musk thistle Carduus nutans from iNaturalist user c-guinan. Link: https://www.inaturalist.org/observations/132367683

Even worse, they didn’t even know that there is an Endangered species of native thistle in those mountains!  We investigated and it looks like they at least didn’t kill any endangered thistles, but it could have been really bad. 


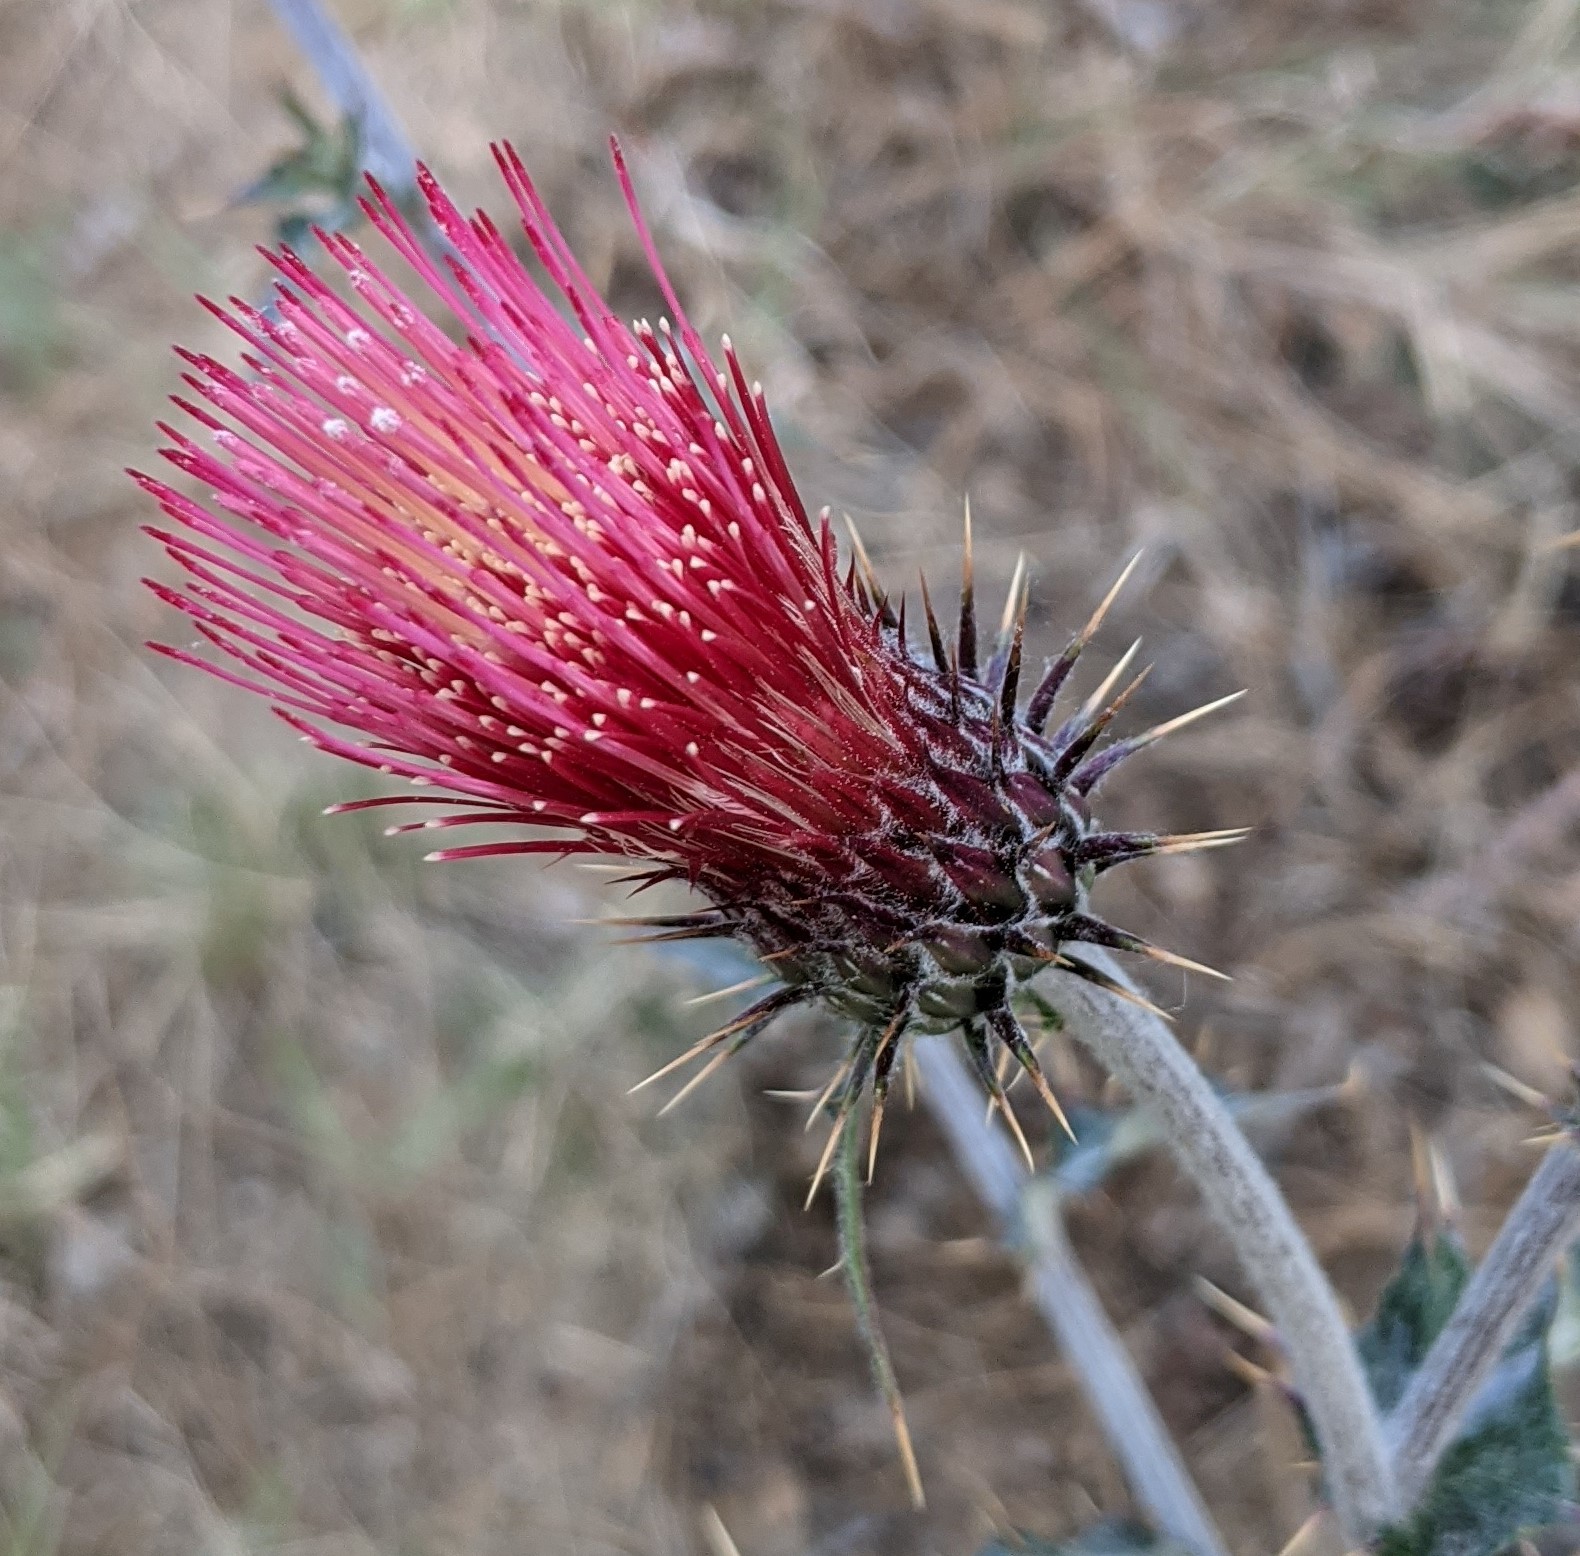
Photo of Endangered Sacremento Mountains Thistle Cirsium vinaceum from iNaturalist user ck2az.  Link: https://www.inaturalist.org/observations/14433149

I’m currently trying to find the volunteers on the Prescott national forest who are pulling up all of the Arizona thistle along popular trails.  Its especially troubling to me when people who are trying to do good by removing invasive species end up destroying native species.

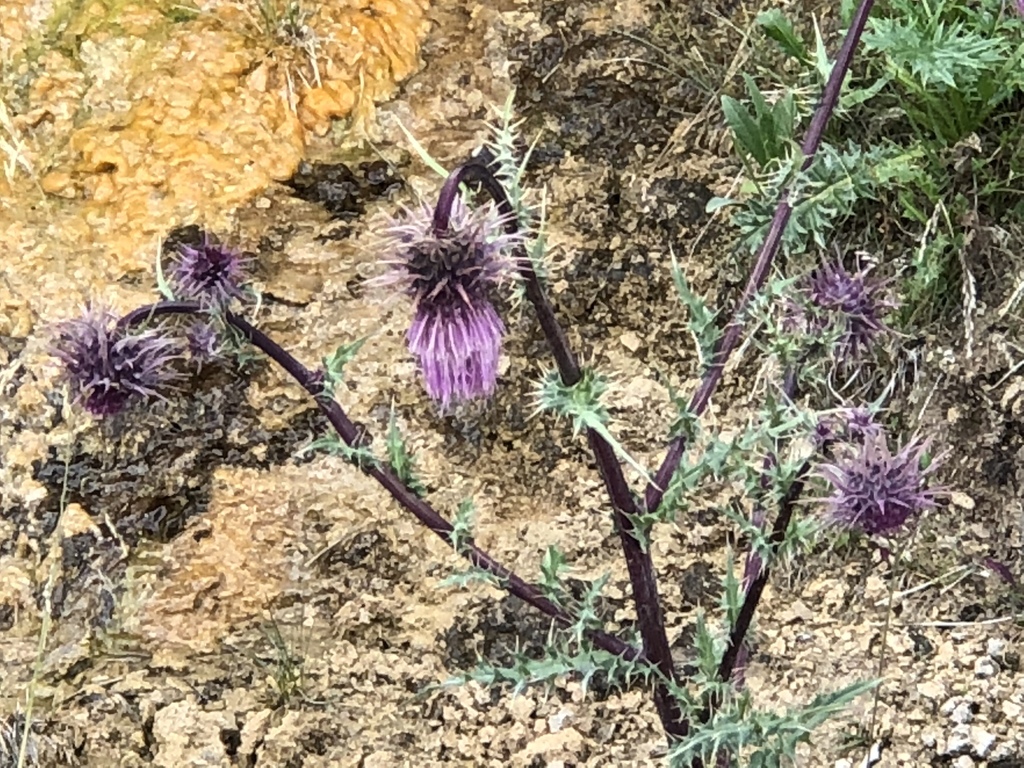
Arizona Thistle Cirsium arizonicum.  My photo on iNaturalist.  Link:  https://www.inaturalist.org/observations/87880049

Everyone who’s done natural resource work has stories of project missteps.  I don’t know how to prevent all mishaps, but talking about these misidentifications is a good first step.

The NM Native Plant Society has a great Thistle ID book written by Bob Sivinski.

Tuesday, August 16, 2022

Renewable Energy's Blind Spot

The Environmental Risks and Opportunities at Solar Sites

In its Clean Energy Commitment, APS laid out a path that includes tripling the renewable energy provided to customers in the next 10 years. Much of that goal will come from large solar sites in the Arizona desert. But what about the environmental, sustainability and governance (ESG) impact of those megawatts?


It may seem counterintuitive to ask about ESG for solar, since renewable energy is considered good for the environment. But utility scale solar sites, like other large developments, can have negative environmental effects depending on how they are sited and maintained.


Rapid renewable buildout without careful siting and maintenance can harm sensitive environments and community relationships.  ESG issues at solar sites may be a blind spot when company metrics are focused on total renewable or clean energy without a biodiversity component. 


Siting


The Arizona desert has areas of high biodiversity that should be avoided during development of renewable energy. Although all projects receive some environmental review, the level of review depends on the landowners, regulators and companies involved. This regulatory patchwork means that projects can be approved while still having significant issues.


For example, a large solar project in California was approved in prime desert tortoise habitat, and the company involved spent at least $56 million relocating the threatened species from its solar site. A different species of desert tortoise lives in AZ, but resource managers here are also concerned about impacts from development.


AZ Game and Fish (AZGFD), in their Guidelines For Solar Development in AZ, call for avoiding areas of high biodiversity, with a preference for already-degraded sites. By using land that has already been impacted by farming or mining, utility solar development can avoid many of the environmental risks associated with building on pristine landscapes.


Maintenance


Solar sites in the desert are usually maintained as bare ground, which involves regular application of herbicides to control any sprouting vegetation. Unfortunately, bare ground can concentrate and channel water, leading to runoff, erosion, and water pollution. And when it doesn’t rain, dust from the bare ground can lower air quality and soil the solar panels, reducing their efficiency.


The AZGFD Guidelines call for native plant revegetation of areas not necessary for facility maintenance. Revegetating parts of the sites with native plant species provides valuable habitat for pollinators and other native flora and fauna. AZGF notes that revegetation can also help control or prevent erosion, siltation and air pollution by stabilizing soil surfaces.


Challenge as Opportunity


The International Union for Conservation of Nature (IUCN) states that “solar developments can demonstrate good environmental stewardship through conservation and rehabilitation of local biodiversity.”


Across the US, solar sites are increasingly evaluated for overall sustainability, including impact to biodiversity. For example, 15 US states have already created environmental scorecards for solar energy sites. Sites with native vegetation that benefits pollinators and other species are rated higher.


Including best management practices (BMPs) in the siting and maintenance of solar sites, such as those in AZGFD Guidelines, can help ensure that solar sites don’t contribute to environmental degradation and are part of the environmental solution they are intended to be.


By proactively addressing these challenges, utilities can show commitment to ESG values while reducing potential conflicts and costs.


Further reading:


https://forestpolicypub.com/2022/08/08/now-comes-the-hard-part-of-the-ira-the-problems-of-siting-wind-and-solar-by-sammy-roth-of-la-times/

Tuesday, April 05, 2022

Aerobic Threshold or How to Estimate Metabolism with the Breath

All text and images from Alan Couzens.

The #AerobicThreshold or first rise in the lactate curve is a key training intensity. 

Primarily because it usually coincides with the highest rates of #FatBurning coupled with relatively low CHO oxidation, so the athlete can accrue a lot of work with minimal metabolic fatigue.

VE = ventillatory efficiency, or how deeply you breathe.  RR = respiration rate.

As the chart above shows, when an athlete begins a progressive metabolic test their VO2 (oxygen) requirements increase almost immediately & in fairly direct proportion to the exercise intensity. It makes sense then that we'd have to increase our breathing to match this, right?

Wrong!

Our body is pretty wasteful with O2 at rest. Our muscles don't take up most of the O2 in the blood & it just cycles around. Therefore, the first port of call when our body needs more O2 is simply for the muscles to take up more already circulating O2 from the blood...

This shows up as an increase in the a-VO2 difference, i.e. the *arterio* *venous* *oxygen* *difference* - the difference between the amount of O2 in the blood of our arteries going into the muscle & our veins coming out...


https://twitter.com/alan_couzens/status/1488891134466084864?s=21&t=GfrF4HO0hBGxSZfFjVoy8g


As we continue to increase the intensity of exercise after moving from nose breathing to quiet mouth breathing, eventually we encounter a second breakpoint in ventilation - the transition from quiet mouth breathing to loud mouth breathing...


This shows up as an increase in the a-VO2 difference, i.e. the *arterio* *venous* *oxygen* *difference* - the difference between the amount of O2 in the blood of our arteries going into the muscle & our veins coming out...

At this point, metabolic acidosis is starting to increase and the body's response to it is to "blow off" the increasing carbonic acid in the form of additional CO2...


This is directly visible in the relationship between VCO2 (the amount of carbon dioxide being produced) vs VO2 (the amount of Oxygen being consumed). At this point in the test the CO2 line takes a turn & begins approaching the O2 line.


https://twitter.com/alan_couzens/status/1489260556934471681?s=21&t=GfrF4HO0hBGxSZfFjVoy8g


Development of Diabetes

Everyone is on the spectrum….


Source:   https://link.springer.com/article/10.1007/s00125-021-05505-4


Tuesday, January 11, 2022

Phenology, Accumulated Growing Degree Days, and Soil Moisture

US Crop Calendar

Source: https://ipad.fas.usda.gov/countrysummary/Default.aspx?id=US


Arizona had a good year for NDVI

Source: https://glam1.gsfc.nasa.gov/


NASA SMAP data.  Data is global.


This mapped layer is delayed by 2 weeks.  I haven't found a layer that shows real-time moisture.


NPN Visualization tool can view Historical, Current, and Anomaly Accumulated Growing Degree Days. Data is only for USA.

Source: https://data.usanpn.org/vis-tool/#/explore-phenological-findings


Wednesday, December 01, 2021

Prescott Water Supply

 The Citizen Water Advocacy Group has good resources discussing this issue.  Here's a video covering frequently asked questions.  


Well water levels are declining by more than 1 foot/year in the center of the aquifer, and have declined more than 100 feet in the last 80 years.  Wells at the edge of the aquifer, such as in Williamson Valley, are declining from 2 to 7 feet per year (data not shown).


2000-2021 Drought in the Southwest


The list of Drought Impacts:

D0  Forage is limited; soil is dry

Fire risk increases

D1 Plants are stressed; hillsides are unusually brown

Stock ponds and creeks are nearly dry; some springs are dry

D2 Water and feed are inadequate for livestock

Fire danger is high; fire crews are mobilizing

Little forage remains for wildlife; pine trees are losing needles

D3 Ranching operations are affected

Fire preparedness increases; fire restrictions are implemented early

Skiing tourism is low; snowpack is extremely low

Wildlife encroach on developed areas in search of food and water

Native plants are stressed

Livestock do not have adequate water; runoff is short; conditions are dusty

D4 Fire restrictions increase; large fires occur year-round

Vegetation green-up is poor; native plants are dying

Lakes, ponds, and streams are dry

Tuesday, October 19, 2021

2021 California Wildfires and Fuel Treatments

This post and discussion on The Smokey Wire is one of the best, with in-depth reviews of the effectiveness of forest thinning to control wildfires.  


https://forestpolicypub.com/2021/09/17/the-caldor-fire-and-fuel-treatments-sf-chronicle-la-times-and-sac-bee-stories/

Wednesday, October 13, 2021

Overnight HRV: Comparison of PPG to ECG

Problem:  Short-duration morning HRV measurements may be susceptible to exactly when you wake, your HR, breathing rate, thinking about work etc in that moment. Different apps report widely different values of HRV.  Perhaps more importantly, morning snapshot measurements do not record HRV over a physiologically meaningful interval.  The best case would be to record HRV 24-7, but this is not feasible with current wearable technology.  However, wearables can and do report night time HRV.  At least this is measuring vagal balance over a physiologically meaningful interval, namely, the sleep recovery timeframe.


Methods: recorded overnight HRV using Polar H7 chest strap connected to the iOS app HRV Logger, for 12 nights over more than a month.  HRV Logger stopped recording on 2 nights, perhaps due to loss of connection with the H7 or other errors, so I have 10 nights of complete data.  The Polar H7 chest strap directly measures electrical activity (ECG) and is considered the gold standard for at-home HRV measurements.  

I also wore a Fitbit Inspire 2 each night and downloaded the data file from Fitbit.com at the end of the month.  Fitbit uses a green light PPB (photoplethysmography) sensor to measure blood flow changes at the wrist and infer heart rate and HRV.  

HRV Logger was set to 5 minute recording windows and RR-interval correction was set at 25%.  Fitbit also reports HRV in 5 minute recording windows.  However, the 5-minute interval windows are only approximately aligned as they are based on offset starting times.  HRV is reported as rMMSD.  


Results:  At this point, I am reporting preliminary data from 3 representative nights.  


Night of 9/19


Summary


Fitbit

Polar

mean

38.5

41.48

std dev

6.75

8.44


Night of 9/21


Summary


Fitbit

Polar

mean

39.82

44.32

std dev

6.94

9.23


Night of 9/28


Summary


FitbitInspire2

PolarH7

mean

35.06

39.57

Std dev

5.31

7.80


Conclusion

An examination of the time course data shows that Fitbit was able to pick up the broad changes in HRV during the night.  It appears Fitbit misses spikes in HRV that the Polar strap is able to detect.  Although it is also possible that the Polar strap is biased by movement artifacts, it seems most likely that either Fitbit is not sensitive enough to detect short-duration changes in HRV, or a Fitbit error-correcting algorithm is too aggressive at removing short changes in HRV.

In addition to being less sensitive to variations in HRV (as measured by standard deviations), Fitbit also consistently records a lower average nightly HRV than the Polar strap.

The overall R squared value is only 0.38, however this statistic probably underestimates the correlation of time series data due to the fact that the 5-minute windows are not perfectly synchronized.  Even so, R squared of 0.38 is a higher correlation that I was able to achieve using the Polar H7 with 2 other apps.