
Tuesday, January 31, 2012

Sunday, January 15, 2012
Ecosystem Art
Larry Eifert has created a number of murals for National Parks:

John Dawson is famous for his ecosystem postage stamps:


John Dawson is famous for his ecosystem postage stamps:

Charley Harper creates iconic abstract animal and ecosystem images:


Tuesday, January 10, 2012
Thursday, December 29, 2011
Canadian Tar Sands
While groping for words to describe mining tar sands in Alberta, Canada, I realized the only word I had was Hell. Humans are creating Hell. I don't know if that is a moralistic judgement or simply the most accurate description. I don't know how I feel about getting oil from the tar sands by strip mining the wilderness fens and forests, nor do I have a definitive "scientific" judgement of how bad for the environment this really is. I don't have a political opinion on the associated plans to haul 3-lane wide super-trucks across Lolo Pass and through Missoula, Montana; nor do I have a completely educated opinion of the necessity of building mega pipelines across the Oglalla Aquafer of Nebraska and through the primeival British Columbia "ghost bear" rainforest to transport the oil steamed out of the tar.
All I know is this:


From National Geographic
All I know is this:
BEFORE

AFTER

From National Geographic
Friday, November 04, 2011

Wednesday, November 02, 2011
Timber Harvest Effect on Soil
The overall effect is a small loss in total soil carbon; both total carbon content and concentration decrease in the "forest floor," but not in the surface or deep mineral soils.
 Black dots are total carbon; white dots are carbon concentration.
 The decrease in total forest floor carbon is greater in hardwood forests, although there is some evidence that it takes longer to rebound in conifer forests because of their lower litter production.
Citation:
Nave LE, Vance ED, Swanston CW, Curtis PS. Harvest impacts on soil carbon storage in temperate forests. Forest Ecology and Management. 2010;259(5):857–866.


Citation:
Nave LE, Vance ED, Swanston CW, Curtis PS. Harvest impacts on soil carbon storage in temperate forests. Forest Ecology and Management. 2010;259(5):857–866.
Tuesday, August 16, 2011
Drought and Heat, Summer 2011
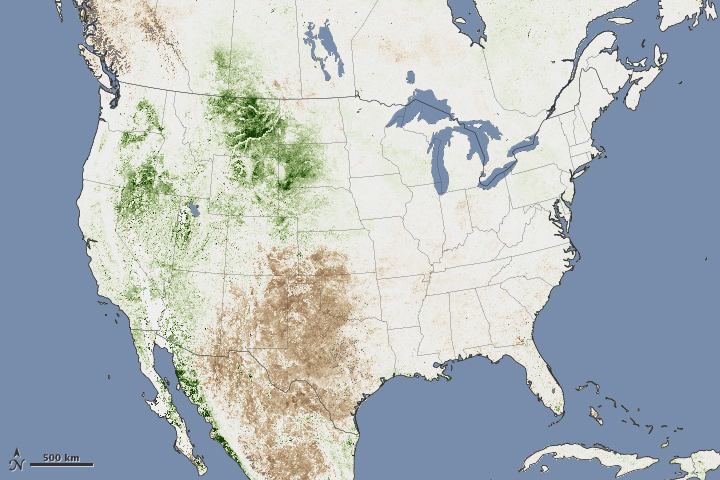
 Earth Observatory.
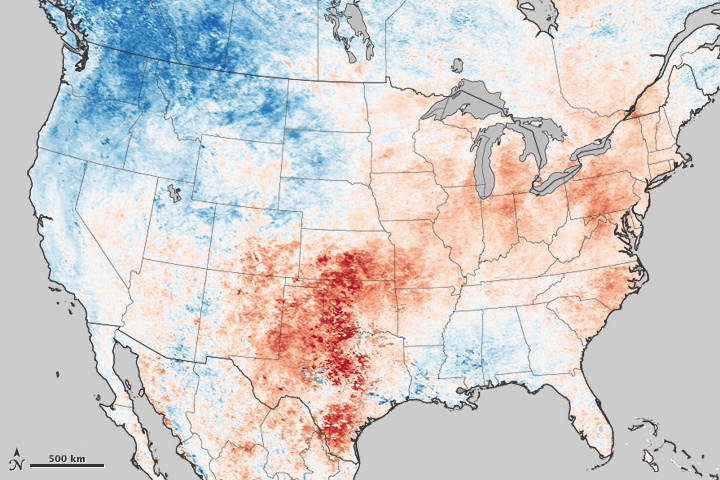
 Earth Observatory: Heat Wave July 20-27 2011.
Explanations: NWS
 Normal July pattern, which has been amplified by strong ridge, the opposite of the winter time "Aleutian Low" NWS.
Tuesday, August 09, 2011
Threatened Forests: a bug for every tree


US Forest Service Alien Pest Explorer Maps:
http://nrs.fs.fed.us/tools/afpe/maps/ Eastern Forest Environmental Threat Center:
Sudden Oak Death
Saturday, June 04, 2011


Friday, June 03, 2011
Variable Land Carbon Sink

b, CO2 emissions from fossil fuel combustion and cement production, and from LUC. c, Land CO2 sink (negative values correspond to land uptake). d, Ocean CO2 sink (negative values correspond to ocean uptake).
Le Quéré C, Raupach MR, Canadell JG, Marland G, others. Trends in the sources and sinks of carbon dioxide. Nature Geoscience. 2009;2(12):831–836.
"An increasing total airborne fraction implies that total sinks are increasing more slowly than total emissions, so that sinks are not keeping pace with emissions.
The CO2 growth rate also varies strongly at interannual (1 to 10 y) time scales, through mainly biophysical mechanisms. Fluctuations in CO2 growth rate correlate with the El-Nino-Southern-Oscillation (ENSO) climate mode (Keeling and Revelle, 1985; Keeling et al., 1995; Jones and Cox, 2005), because the terrestrial carbon balance in tropical regions is tilted from uptake to release of CO2 during dry, warm El-Ni ˜ no events (Zeng et al., 2005; Knorr et al., 2005).
Volcanic events are also significant: the CO2 growth rate decreased for several years after the eruption of Mt. Pinatubo in June 1991 (Jones et al., 2001), probably because of increased net carbon uptake by terrestrial ecosystems due to higher diffuse solar radiation (Gu et al., 2003) and cooler temperatures (Jones and Cox, 2001) caused by volcanic aerosols."
1. Raupach MR, Canadell JG, Le Quéré C. Anthropogenic and biophysical contributions to increasing atmospheric CO2 growth rate and airborne fraction. Biogeosciences. 2008;5(6):1601–1613.

Carbon Tracker
 Fig. 1. A demonstration of how carbon flux indices [GSNF, growing season net flux; DSNF, dormant season net flux; AMP, amplitude (|DSNF – GSNF|); NCF, net carbon flux (GSNF + DSNF)] are calculated. Any month for which the net carbon flux is negative is included in the GSNF (open vertical bars). Any month for which the net carbon flux is positive is included in the DSNF (filled vertical bars). Mean 2000–2008 fluxes shown for boreal North America (a) southern Africa (b) and tropical Asia (c).
GURNEY KR, ECKELS WJ. Regional trends in terrestrial carbon exchange and their seasonal signatures. Tellus B.

 Fig. 2. Comparison of decadal mean net carbon flux for individual land regions. Black cross symbols (X) denote the mean of 13 TransCom 3 models, open circle symbols (O) denote mean of the three S07 TransCom 3 models, individual model estimates within the S07 average are denoted by a filled square, circle and triangle. Vertical error bars represent the total 1σ flux uncertainty (quadrature sum of model spread and the root mean square of individual model posterior uncertainty) associated with the mean of the 13 TransCom 3 models. (c) 2000–2008 mean net carbon flux.
Subscribe to:
Posts (Atom)