Nutritional yeast is tasty and nutritious! How nutritious is it? Well, that depends on whether it is fortified or not, and how much information you find on the nutrition label.
After looking at the labels of about a dozen brands, I found that nutritional yeast is consistently a good source of B2, B3, and B5, and with fortification is a great source of all major B vitamins except probably B7.
Fortified nutritional yeast contains extra B vitamins and sometimes iron. These extra nutrients are added during the processing of the product to make it more nutritional. The vitamin content of fortified nutritional yeast depends on how much it is fortified.
For example, here are two popular brands, Braggs and Bob's Red Mill:
 |
| % Daily Value (DV) per 2 tablespoon serving. Data reported from nutritional labels. |
Both brands add supplement B1, B2, B3, B6, B9, and B12, but they add different amounts. In general, both seem to try to add more than 200% and less than 500% of the daily value. Bragg adds more of most B vitamins, but Bob's Red Mill adds more Folate (B9). Neither brand reports any B5 or B7, but that doesn't mean they don't have any. According to my analysis of unfortified nutritional yeast, they probably just didn't bother to measure and/or report it.
Non Fortified or Unfortified Nutritional Yeast contains only the vitamins and minerals found in the yeast cells and has no added vitamins and minerals. It contains variable amounts of B vitamins due to differences in yeast strain, growth substrate, growing conditions, and deactivation temperature.
While some brands (like Anthony's) don't report any nutritional values, I was able to find 7 brands on Amazon that reported nutritional testing results for their products:
 |
| % Daily Value (DV) per 2 tablespoon serving, data reported from nutritional labels. |
Note that unfortified nutritional yeast does not contain B12. For other B vitamins, the percent daily values are generally less than 100% and usually less than 50% per 2 Tablespoon serving.
Another way to visualize this information is by Brand:
 |
| % Daily Value (DV) per 2 tablespoon serving, data reported from nutritional labels. |
Microingredients and Naturebell are the most consistent. Sari reports the least number of vitamins. Food Alive reports some very high levels but also some very low levels. Revly is also missing several vitamins. They also reported more than 400% B2 but I removed this outlier; it may have been due to testing fortified nutritional yeast by mistake.
The differences between brands are larger than the similarities. Some brands reported zero or almost zero B1, B2, B6, and B7. Conversely, other brands reported over 100% DVs of B1, B2, B5, and B6. Only B3 and B5 were consistently reported with decent amounts across all brands.
If we assume unreported values are not zero but were just not measured and look only at the vitamins reported by each brand, the mean vitamin content of unfortified nutritional yeast looks pretty good. However, the standard deviations are as large as the reported values for 4 of the 7 B vitamins. While some brands are good sources of B1 and B6, some were quite low for these nutrients. It seems that unfortified nutritional yeast can only be relied on to supply more than 20% daily value per serving for B2, B3, and B5:

Note that all of these unfortified nutritional yeast brands contain B5, so it seems likely that fortified nutritional yeast brands also contain this important nutrient and simply fail to test and/or report it. However, the percent daily value for B5 is much less than that of other B vitamins in fortified nutritional yeast.
Four of the seven unfortified brands reported B7, so it is likely that the other unfortified and fortified brands also contain this nutrient, but fail to test and/or report it. However, even the brands that report B7 report such a small and variable amount, nutritional yeast probably cannot be relied on as a good source of this important vitamin.
** Update **
I reached out to Sari Food to ask if their package listed nutritional values for all B vitamins, or if some were omitted. They confirmed that some were omitted and provided me with a new nutritional analysis that differed significantly from the nutrition reported on the package.
The new analysis reported 7 B vitamins, compared to the package that only lists 3. Their analysis showed significant amounts of B1 and B7 that were not listed on the package. Interestingly, the new analysis also differed from the package for the 3 listed on the package. I think this shows the variability between different batches of the same product.
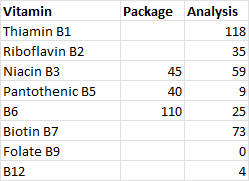 |
| % DV of B vitamins for Sari Nutritional Yeast |
Revised Figure showing % DV by brand:

These results increased the average % DV of the 7 brands in my sample for B1 and B7, and decreased the % DV for B6. This now shows that unfortified nutritional yeast are generally good sources of B1, B2, B3, B5 and B7. B6 appears to be less common, and I'm not confident that the B9 data is accurate - Sari's new analysis still didn't report any Folate. Unfortified nutritional yeast is not a good source of B12.
 |
| Updated with new analysis from Sari Foods. |


