Showing posts with label water. Show all posts

Friday, October 17, 2025

Desert People Without Water

I recently visited the ruins at Honanki and Palatki.  These are prehistoric settlements built into the red rock cliffs near Sedona, AZ.  Today, the people who built these dwellings are called "Sinagua", which comes from Spanish for "without water".  But everyone needs water, right?  I wondered where these people got drinking water.

I looked for springs around Honanki and Palatki and didn't find any.  That's weird!

Zoom in to see locations of Honanki (H) and Palatki (P) in relation to USGS-mapped springs (blue) and NAU-mapped springs (green).

Although springs have dried up in recent times, the USGS spring data was mapped in the late 1800s / early 1900s when many more springs were flowing.  It looks like the geology of the Sedona Red Rock cliffs just don't produce springs.  So even if the location of springs was different 800 years ago, it would be surprising if there were springs in the cliffs where these people lived.

The closest mapped spring (blue dot = unconfirmed water source) is 1.5 and 2.7 miles away, respectively, but there is no evidence of water in the aerial imagery.  The next closest (green dot = confirmed water source) is 4.7 and 3 miles away, respectively.   Neither Palatki nor Honanki is even built in one of the larger drainages that might flow more often/longer; the drainages that feed their valleys are quite short.  

I don't think these settlements had access to aboveground water throughout the year unless they dug wells or used cisterns to store water.

These and other prehistoric communities in the desert Southwest often built cliff dwellings high above canyon floors, far from surface water sources.  Archaeologists believe these people collected runoff during rainstorms using check dams and seeps, and stored water in cisterns or ceramic containers for later use.

Across the prehistoric Southwest, populations used ingenious methods to exploit scarce water:

  • Rock overhangs and cisterns captured and stored rainwater.
  • Seasonal mobility allowed families to occupy dry sites part of the year.
  • Terraced fields, check dams, and soil-retention walls conserved moisture for crops.
  • Small permanent settlements clustered near ephemeral water sources, such as seeps and seasonal pools.

In conclusion, while many large settlements in the prehistoric Southwest were built near springs or rivers, groups like the Anasazi, Sinagua, and others developed highly effective ways to survive in water-scarce environments through dry-land agriculture, runoff collection, and strategic mobility.

Tuesday, October 14, 2025

Atmospheric Streams Subsidize Valley Forests

I invented a new term to describe small-scale flows of water in the atmosphere.  Just as atmospheric rivers are large flows that transport tropical moisture thousands of miles to the mid-Latitudes, atmospheric streams share the moisture of the mountains with the valleys.

Example of an atmospheric river: Hurricane Priscilla projected track from October 7, 2025.  The remains of this storm brought copious moisture to the desert Southwest.


I first starting thinking about this when I noticed that the new weather station in the Watson Woods Riparian Preserve was often colder in the mornings than weather stations on the surrounding hills.  

Note the 40 degree temperature swing from cool (30's!) temperatures at night, to warm (80's) temperature during the day.

This is caused by katabatic winds from the mountains:

"On clear nights with calm winds, the ground cools rapidly. Air in contact with the colder ground cools by conducting heat to the ground. When this cooling process occurs along mountain slopes, the cooling air becomes colder and denser than the air away from the slopes, which causes the cold air to sink downslope. The dense cold air flows downslope in streams (called katabatic winds) following the steepest slopes. When the cold air flows into a relatively flat area (a mountain or river valley, for example), the streams of cold air slow down. This causes the valley to fill with cold air, much like streams filling a lake. "(MountWashington.org)

Hubbard Brook Experimental Forest, a good example of cold air drainage.

Atmospheric streams are distinct from the riparian drainages they follow, because air flows differently than water:

"Air flows in much larger volumes relative to the topographic surface. Water, even in hillside gullies, flows in volumes that are small relative to the scale of the landscape, and hence topography is the major control on the flow. Air masses are generally much larger relative to the landscape. This can lead to rather different effects. When a shallow cold air flow is moving slowly or is strongly stratified, it can become trapped by topographic barriers that would not trap water. Conversely, when the cold air flow is rapid or has lower stratification, it can flow over barriers, rather than go around them and so minimize friction.” (Research Meteorology)

Cold air flows are an important part of riparian ecology.  A study at the Coweeta Long Term Ecological Research (LTER) site found that cold air drainage subsidizes valley ecosystem productivity.  The study observed lower temperature air from the mountains cooling riparian forests, which lowered their carbon loss due to plant respiration.  The cool air must be a welcome respite for plants during the heat of summer.

Image from Coweeta LTER site in the South Carolina Appalachian mountains.

Cool mountain air can also be moister than valley air, especially in arid regions like Arizona.  Riparian streams carry water from mountains to valleys, while invisible atmospheric streams carry water in the form of humidity.  The extra boost in humidity only becomes visible (as fog) when the temperature drops below the dew point. The studies I looked at did not measure humidity, but it makes sense that higher elevation forests would have moister air than the hotter valleys.  When they share their air, they share their water.

Atmospheric streams are an important, but often overlooked, part of the global water cycle that carries moisture from the land to the ocean.  The recycling and transport of water from one part of the land to another part is sometimes called the "small water cycle".  We still have much to learn about the way our planet works!

El autobus magico: viaja por el agua

Wednesday, July 24, 2024

Cutting Trees for Water: Are Thinned Forests Wetter or Drier?

Forest thinning can be controversial.  Concerned citizens want to know when logging counts as restoration;  can thinning a forest have beneficial ecological effects beyond reducing the risk of stand-replacing wildfires?  Will cutting trees increase soil moisture because there are less "straws sucking up water", or does it decrease soil moisture due to increased windspeed and more sunlight drying out the forest understory?

April 2017 - views of Rogers Lake, AZ overlooking untreated (left) and treated (right) areas.  Photos by Conor Flynn.  Click this link to play with the slider.  


Whether thinned forests are drier or wetter is complicated.  The excellent paper "Adapting western North American forests to climate change and wildfires: 10 common questions" by Prichard et al provides a good introduction to this question:


"Decreasing canopy bulk density can change site climatic conditions (Agee and Skinner 2005). Wildfire ignition potential is largely driven by fuel moisture, which can decrease on drier sites when canopy bulk density is reduced through commercial thinning (e.g., Reinhardt et al. 2006). Reduced canopy bulk density can lead to increased surface wind speed and fuel heating, which allows for increased rates of fire spread in thinned forests (Pimont et al. 2009, Parsons et al. 2018). Other studies show no effect of thinning on surface fuel moisture (Bigelow and North 2012, Estes et al. 2012), suggesting that thinning effects on surface winds and fuel moisture are complex, site specific, and likely vary across ecoregions and seasons."

Anecdotally, some people have noticed springs beginning to flow again after thinning and prescribed fire in AZ.  My research in NM pinyon noted increased soil moisture at thinned sites (unpublished data), however this could be due to the specifics of how thinning was accomplished at those sites.  Thinned slash was chipped and the chips were left on-site without follow-up prescribed fire.

In addition to water quantity, water quality should also be considered.  Prichard et al point out that "Treatments in watersheds that are distant from the WUI and protect municipal and agricultural water supplies are critical to minimizing high-severity fire impacts that can jeopardize clean water delivery (Bladon 2018, Hallema et al. 2018). For example, post-fire erosion and debris flows may cause more detrimental and longer-term impacts to watersheds than the wildfires themselves (Jones et al. 2018, Kolden and Henson 2019)."  However, even carefully managed thinning and prescribed fire can generate excess erosion from new roads, decreased large woody debris, and increased mobility of light charred wood.  Charcoal washing into local lakes can cause fish kills, even when not generated by catastrophic wildfire.  Creating erosion-control structures as part of forest thinning work could help to mitigate these risks.  

Further research is needed to ensure that large thinning projects adequately account for water cycle restoration in addition to natural stand density and fire interval restoration.  

Rain Walks

This is a story from Paul Krafel that I think should be more widely known and celebrated.  Thank you, Paul.


Rain Walks

A simple play I’ve made hundreds of times exemplifies “every play is two plays.” High in the drainage, as runoff increases, the rising runoff begins overflowing its shallow channels, spreading out into easily overlooked overflow routes. Sometimes a rock lies in the overflow channel, obstructing how much of the runoff can flow that way. I lift the rock out of the channel so that more of the runoff can flow in this new direction (Play One). I then place that rock in the main channel so that it shunts more of the runoff towards the overflow channel (Play Two). 

This simple moving of the rock is two plays. The broader, slower overflow route receives more runoff because of the removal of the rock, and the deeper main channel receives less because of the new placement of that rock. Though much of the water still flows down the main channel, more is now flowing along the broader, slower overflow route.

Rising water has a distinctive appearance. Surface tension holds the water’s surface against plant stems and rock edges so that this ring of contact lags behind the rising level of the surrounding water. This creates a dimpled surface around each stem and rock sticking up out of the water. These dimpled surfaces sparkle with focused light. I can watch this dance of light advance with the increased flow down the overflow route.

Read more here...

Another interesting article by Paul here.  

Wednesday, December 01, 2021

Prescott Water Supply

 The Citizen Water Advocacy Group has good resources discussing this issue.  Here's a video covering frequently asked questions.  


Well water levels are declining by more than 1 foot/year in the center of the aquifer, and have declined more than 100 feet in the last 80 years.  Wells at the edge of the aquifer, such as in Williamson Valley, are declining from 2 to 7 feet per year (data not shown).


Wednesday, March 11, 2020

OTEC: Ocean Thermal Energy Conversion

OTEC has the potential to harness the power of the ocean, while pumping water from the depths to the surface has challenges and opportunities. It can fuel plankton growth and may help sequester carbon.

1982 National Energy Laboratory Report on OTEC


The xerox scan of the old scientific report is dark and stained, with primitive printing and poor font and layout.  But the columns and official investor report style belie the real science presented, without preamble or typical science summary.

The 1-mile long cold water pipe was deployed successfully in 1981, thanks to "Calm weather and much hard work."  The pipe extends from the surface to 2,000 feet deep. It can pump 500 GPM of deep cold 9-10 C) water. The warm water pipe pumps 2,000 GPM of surface seawater (24-28C).  When allowed to foul freely, it showed immediate increase in resistance to heat transfer, which biofouling countermeasures ameliorated.

The article presents a glowing portrait of research advancing at a fast pace, but is offset with somber photos of cloud-mottled skies and the inclusion of disturbing headings like "biofouling countermeasures". (Biofouling is when nimals get sucked in, and the system can become clogged by marine animals and plants.  This could also be used positively to grow algae) Funding is flowing in from multiple sources like the cold and warm water siphoned from the rich offshore resources...

The project is strategically located with nearby availability of cold, deep ocean water and a warm ocean surface layer that is not subject to strong seasonal cooling. The warm water intake only 15 feet offshore may explain the much more rapid initiation of biofouling than previous experiments.  A 300 foot extension has been designed and was to be installed in 1983.  They plan to add 2 new 500 GPM pumps to replace the original coldwater pump that only pumped from Feb to June at 340 GPM before failing.  They propose reconfiguring the OTEC-1 coldwater pipe to provide a capacity of 22,000 GPM, which would "satisfy their coldwater needs for the foreseeable future."


What ever became of all of this? The Makai Engineering website presents research from the 2010s that seems directly related to work done in the early 1980's, as if a 30 year gap is missing from the story, a lull in research perhaps while people's careers stagnated, limited by something mundane like the size or strength of piping availability or funding.  Maybe the ocean was still there but the money stopped coming from Washington.  Reagon took the solar panels off the white house, and the country went back to sleep for 30 years while a couple of billion people were born and the climate inched toward the 2 degree warming threshold. 

This dark paper seems to hold secrets of the past, arcane mad science experimentation. All that is not said, like the sea creatures sucked up.  So that today when ocean researchers wonder about the effects of cold water outfalls they have to design and bring their own small pipes and pumps.


2008 Reserach: Artifically Induced Upwelling
Used to understand how marine microbial ecosystems respond to large-scale perturbations. Diatoms will consume nitrogen, leaving some amount of phosphorus in the water, which will stimulate a second-stage bloom of nitrogen-fixing cyanobacteria. These blooms are often observed during summer months in open ocean waters when there are almost no nutrients at the surface and the winds generally are calm. What triggers the blooms and where are the nutrients coming from? We need to know.

Vast, seemingly barren regions comprise more than two-thirds of our oceans and nearly 40 percent of the entire Earth.  Need to replace about 10 percent of the surface waters with upwelled water to fuel a bloom.  Some scientists have looked at iron fertilization as a way to trigger biological growth in nutrient-poor areas of the ocean, but “everything responds to iron,” Letelier said. “You can’t control what grows.”

The researchers believe they can control plankton growth by determining which species respond to specific nutrients, and then adjusting the rate of nutrient feeding by the frequency and duration of water pumping.

Where the ocean is about 4,500 meters deep, the bottom layers of water have too much CO2 because of the decaying organisms that have sunk to the floor.  Their studies have shown, however, that water at a depth of 300 to 700 meters has the proper ratio of nitrogen and phosphorus to trigger a two-stage phytoplankton bloom.

Currently, they are able to pump about 50 cubic meters of water per hour (=4 GPM) using wave energy. "If we want to generate a bloom in an area of one-square kilometer, we would need to replace about 10 percent of the surface waters with upwelled water, which would take about a month at the rate we pumped.”

The scientists used undersea gliders in their Hawaii study to monitor the water from the pump so they have an idea how widely and quickly it disperses, and how much of an impact it can have on surface waters.


Resources
List of OTEC plants around the world: https://en.wikipedia.org/wiki/Ocean_thermal_energy_conversion

1982 report about OTEC work at NEL Hawaii: https://nelha.hawaii.gov/wp-content/uploads/2014/01/NELH_AnnRpt_1982.pdf

Upwelling Press Release: https://today.oregonstate.edu/archives/2008/sep/scientists-test-%E2%80%9Cartificial-upwelling%E2%80%9D-learn-more-about-complex-ocean-ecosystem-be

More NEL reports: https://nelha.hawaii.gov/resources/library/

Makai Engineering: https://www.makai.com/ocean-thermal-energy-conversion/

Wednesday, September 28, 2016

Albuquerque 2016 Monsoon Season

From the ABQ NWS Homepage.
The monsoon began early in Albuquerque this year, with a week of good moisture at the end of June. But then June high pressure returned and most of July was hot and dry.  It wasn't until the beginning of June that the rains reliably returned.  Overall, the monsoon wasn't bad, but the hiccup in the beginning ended up dooming most annual plants.  Only perennials managed to reap the rewards of the late-breaking monsoon moisture.  Now, at the end of September, many monsoonal plants are still trying to finish flowering and set seed.  Many plant species are flowering late and show signs of stunted growth.

Wednesday, January 06, 2016

Welcome to the High Desert of New Mexico, USA


Surviving in the High Desert of New Mexico is like visiting another planet.

I suggest you find a house with a good airlock and sunshade, but you won't be able to filter out the cosmic rays; living up here is like being an airline stewardess.

The desert has a way of simplifying human needs: water, oxygen, respect (for the sun), oh, and more water.

The most important thing is water. You have to drink all the time. When you wake up in the morning you must drink a full nalgene; you've lost at least that much through exhalation during the night. I suggest miso bone broth soup to replace the electrolytes as well. Its dry here and you can't always tell when you're sweating because evaporation is so efficient.

Sometimes you can't drink enough water. The answer is coconut water. Always keep some at hand in case of emergencies.

High altitude. One of the commonest complaints (after dehydration, always check that first) is low oxygen. People forget to breathe. You have to really move that diaphragm! Ginseng and other tonifying herbs might help, too. Oh, and bone broth soup. Think like a sherpa.

Sun. I used to go without sunblock, but we're too close to the sun here. Respect the sun. Always wear sunblock when you have exposed skin - or wear a burkha. UV-blocking sunglasses are also, sadly, necessary. I hate wearing glasses, but if you don't the Light will wash away your world. Yes, it is possible to sunburn the back of your eyes.  8-(

Moisturizer. Dry skin is serious. One secret to prevent over-drying is to always end showers with cold water; it tones the muscles and closes pores in the skin so you don't lose all your hard-earned moisture. Never, ever use drying soap. I don't think that should be a problem, but I'm warning you now: Don't let cracks form on your hands or it will be Too Late, and you'll be covered in bandages like a mummy.

 Welcome to New Mexico!

Friday, August 28, 2015

Juridicational Wetlands

 The Clean Water Act (CWA) regulates all of the "navigable" water bodies in the U.S.  The precise definition of navigable waters is important for specifying what impacts may or may not be allowed to the Waters Of The United States (WOTUS).  However, since the inception of the CWA, numerous Supreme Court cases have challenged the definition of WOTUS.  On May 27, 2015, the U.S. Army Corps of Engineers (USACE) and Environmental Protection Agency (EPA) issuing a new definition of WOTUS.  While the new definition is already the subject of numerous lawsuits, it is now the new basis of the CWA.

Graphic from SWCA, The Wire.
So what does the new definition say?  Well, it is pretty straight-forward.  There are just 8 possible cases:  

1. traditional navigable waters
2. interstate waters
3. territorial seas
4. impoundments (of 1 - 3 above and 5 below)
5. tributaries
6. adjacent waters
7. five special groups of similarly situated waters
8. case-specific significant nexus waters  

For more information, see this excellent article in SWCA's The Wire.

Monday, January 19, 2015

Top Conservation Stories of 2014

Here are a few of the most important conservation stories from 2014:

--Gila River Proposed Diversion approved by ISC

--Mexican Gray Wolf critical habitat expanded to include most of NM and AZ south of I-40

Zone 1 is where Mexican wolves may be initially released or translocated.  Zone 2 is where Mexican wolves will be allowed to naturally disperse into and occupy, and where Mexican wolves may be translocated.  Zone 3 is where neither initial releases nor translocations will occur, but Mexican wolves will be allowed to disperse into and occupy....where Mexican wolves will be more actively managed...to reduce conflict with the potentially affected public.  However, in AZ east of Highway 87 there will be a "phased approach" to managing wolf populations.

--U.S. Congress Omnibus spending bill approves the Resolution mine landswap in AZ, grazing lease terms expanded to 20 years, and Valles Caldera becomes newest National Park

--Drought in CA (7% snowpack) ... and NM.  (e.g. Heron Lake resevoir levels fall, fail to make San Juan-Chame deliveries to Rio Grande)

-- US EPA and NRCS try to regulate agriculture under CWA....and fail.  The problem of increasing toxic algae problem in Ohio lakes came to a head in 2014 when Cleveland had to turn off their city water intake from Lake Eerie due to a toxic algal bloom. The proposed rule would have allowed EPA to regulate "non-point source" water pollution from farms that did not have a NRCS-approved conservation practices in place.  But apparently the outcry was too much, and early in 2015 the rule was amended.  Note that the final rule, even though it no longer contained this provision, was still vehemently protested in 2015.

--  Gunnison Sage Grouse listed as "Threatened" under the ESA, Colorado appeals.

-- Colorado River Pulse....mostly just grows more tamarisk.

--  Pleistocene megafauna extinction due to meteor impact, new study finds.  

-- Wilderness turns 50 years old

-- New "stacked trait" GMO potatoes and soybeans approved in the U.S.

And a random tidbit:  rabbits eat more forage in utah than bison...leading ranchers to question the state's continued bounty for coyote skins.

Monday, September 15, 2014

A streamlined, GIS version of USDA's Environmental Benefits Index

USDA calculates the environmental benefits of applying conservation easements to farmland.  The University of Minnesota has developed an online tool for mapping three important components used by decision-makers to prioritize farmland conservation funding:

Soil loss is calculated using the Universal Soil Loss Equation, which factors in slope angle and distance, soil texture,

Water quality risk was calculated using a Stream Power Index, and proximity of land parcels to streams.

Habitat quality was calculated using by intersecting known stressors such as roads and development with known areas of high quality habitat, such as areas with endemic or endangered species, high biodiversity, and/or high game abundance.

The combined metric for all three layers generates the Environmental Benefits Index.
Screenshot from maptool from the EBI page of the Natural Resources Research Institute at the University of Minnesota.


Friday, September 05, 2014

Review of Soil Moisture Measurement Techniques


Advances in efficient, broad measurement of soil moisture are needed to understand plant stress response to drought.  Crop growth and phenology can be predicted (link) with accurate modeling of soil-plant-atmosphere interactions.  These dynamics are also crucial for advances in meteorology, since most rain that falls in the U.S. is recycled rain that has already fallen and evaporated at least once before, but often several times.  Accurate prediction of rainfall will continue to elude meteorologists until soil moisture can be measured and predicted.

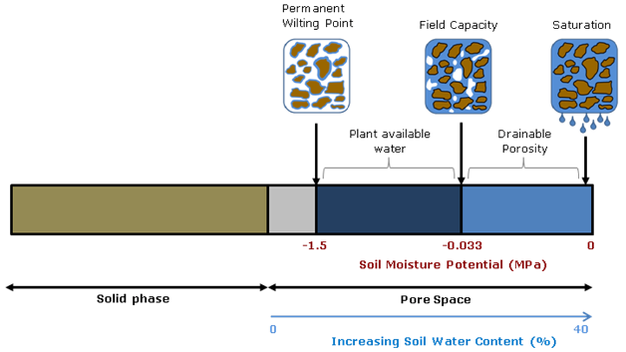
Soil moisture is critical for advancing plant and atmospheric sciences,  but the fact that different measurement techniques yield different values points to the fact that soil moisture is essentially an abstract idea.  While the water content of soil would seem to be straightforward, whether you calculate volumetric or gravimetric water content, and whether you consider chemically- and physically-immobilized water or only plant-available water (field capacity minus permanent wilting point) matters a great deal.


Diagram source.

Spatial and temporal scale also matters.  Do you want an instantaneous point measurement, or a daily weekly average for an entire county’s drought status?  Picking the right tool for the job means understanding the streghths and weaknesses of the entire gamut of technologies capable of reporting soil moisture.  This article will start with traditional in situ point measurement techniques and continue to review broad-scale soil moisture modeling and remote-sensing efforts.


from Shuttleworth 2013

Small-scale measurement can be accomplished using point-sampling with portable soil moisture probes, such as TDR and traditional (active) neutron probes.  Of course, any discussion of soil moisture measurement techniques would be incomplete without mentioning the gravimetric method, or simply weighing a soil sample wet and then dry.  But as with the other point techniques, this method can only measure hyperlocal conditions and must be replicated and averaged to inform landscape-scale management.

TDR, or time-domain reflectometry, uses the electrical properties of soil and water to calculate volumetric percent soil moisture.  For most soils, excluding those with very high organic matter (OM>10%), the TDR method without calibration provides water content in the range from zero to 50% with accuracy better than 1-2%.  While calibration and new TDR such as TRIME-TDR can improve accuracy by a factor of 10-100, the amount of microscale variability in soil means that these point measurements must be replicated dozens to hundreds of times to build up a picture of average site moisture. Microvariability can be important when precipitation preferentially flow along soil heterogeneities such as roots, textural changes, and bioturbation pathways.    Buried probes that use the TDR techniques, such as the Stevens Hydroprobes I used in my graduate research, are fixed in place and are therefore severely limited by their inability to average site variability.
  
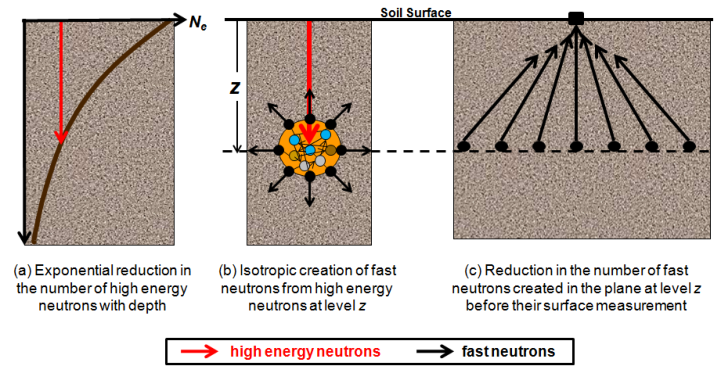
Traditional neutron probes work by bombarding the soil with high-energy neutrons and recording the number of neutrons emitted by the soil.  Hydrogen absorbs neutrons so the amount of H2O can be calculated.  This technique solves many of the problems of TDR, but the sensors are expensive and the measurement still must be repeated several times to measure field soil moisture.  

-

Meso-scale measurement can now be accomplished using the new COSMOS (Cosmic-ray Surface MOisture Sensor) program to measure whole ecosystem moisture.  Neutron moisture probes have been around for decades but COSMOS uses advances in particle-physics technology to increase sensitivity enough to rely solely on the background cosmic radiation as a uniform source of neutrons.  This advance makes possible, for the first time, instantaneous field-scale measurement of soil moisture.


These new sensors were originally deployed in 2010. They have the potential to revolutionize studies of soil moisture because they are the only technique to measure soil moisture at scales between the hyper-local point measurements and the kilometer-swaths of satellites.  They also are the only soil moisture probe that can account for water stores in living tissue.  According to Hydroinnova, one company that makes these $10,000 units, the measured soil footprint is 86% within 350 meters and the effective measuring depth changes with soil moisture, from a maximum of 70 cm in completely dry soil, to a minimum of 12 cm in saturated soil. 


Source.
While these sensors are few in number and relatively widely dispersed, they offer a whole new picture of soil moisture at the landscape level.  They are the only truly effective direct measure of soil moisture at the hectare level, and can be used to better calibrate the informational products discussed below.  However, as with all techniques, COSMOS must also be calibrated to take account of different soil types and changes in vegetation.

-

Large-scale measurement of soil moisture can be accomplished using proxies, satellites, models, or some combination of techniques.

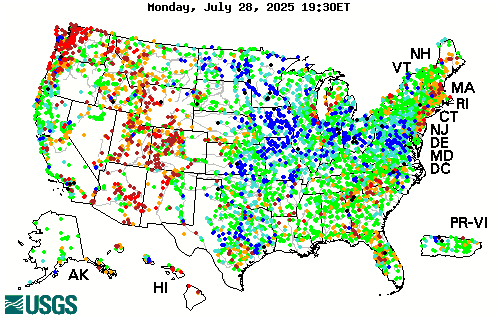
River flow data can reveal how much water is running off or through the soil from watersheds, so using a site like the USGSstreamflow network is a good proxy for large-scale short-term drought and deluge.


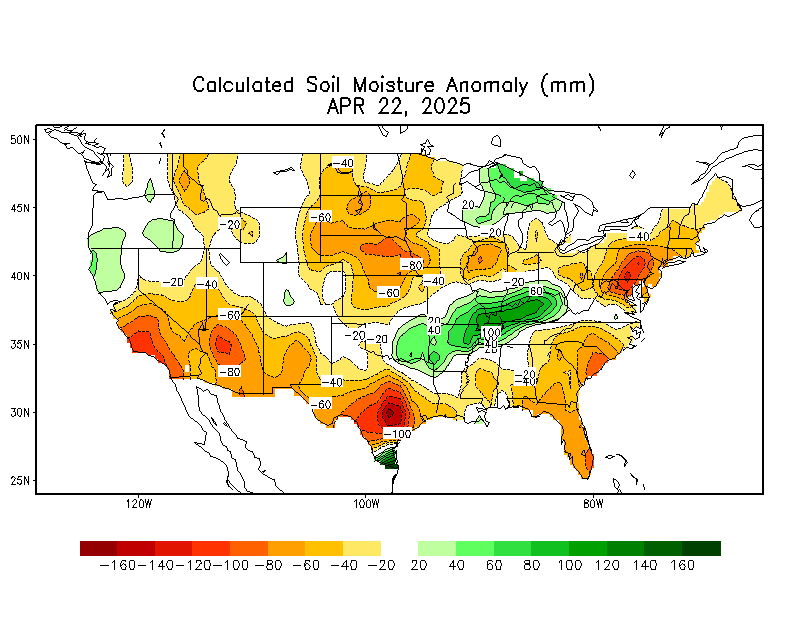
The current best methods for estimating large-scale soil moisture are the Drought.gov model products, which include the Palmer Drought Severity Index, soil moisture index, etc.  The Calculated Soil Moisture Anomaly is calculated based on observed precipitation and temperature.  Soil moisture, evaporation, and runoff for the entire US and globe are then modeled based on observations from a small area of eastern Oklahoma.  While this method is clearly biased, it is the best available.

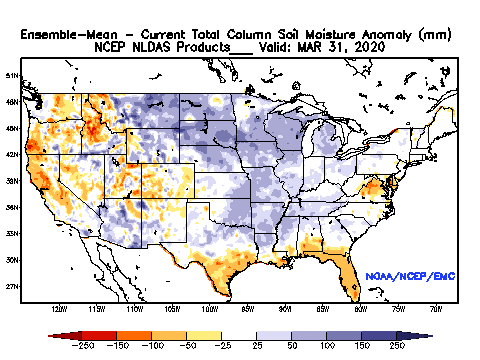
The National Land Data Acquisition System is developing a more accurate model of soil moisture that incorporates soil textural properties and average percent vegetation (which impacts evapotranspiration).  The precipitation data used in the model is at approximately 25km resolution, interpolated to 13km grid cells:


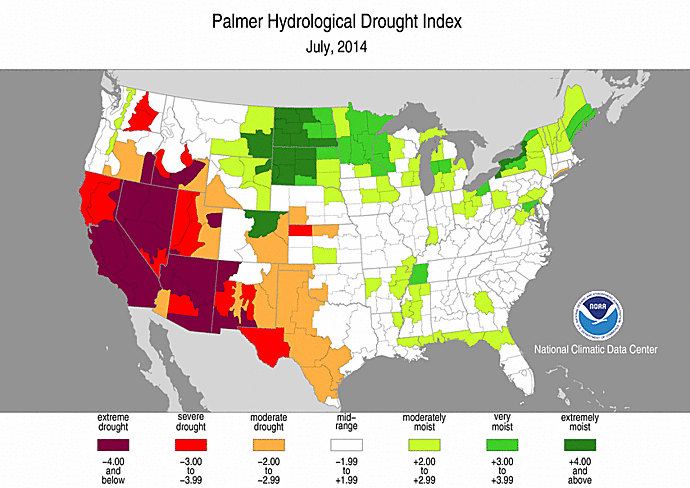
Palmer Drought Indices are similar to soil moisture models in that precipitation, evapotranspiration, and runoff are used to calculate remaining water balance.  There are long-term (Palmer Drought Index (PDI) and Palmer Hydrological Drought Index (PHDI) indices that measure changes in groundwater and reservoir levels, and short-term indices (Palmer Z Index and Crop Moisture Index (CMI)) that affect agriculture during the growing season.


 Interestingly, the US Drought Monitor, which looks essentially like one of the Palmer indices, is subjectively drawn using “a blend of science and subjectivity”.


Friday, April 19, 2013

Three years of New Mexico Drought


Percent of Normal Accumulated Precipitation from the last 6 months.  from water.weather.gov

Here's the last 36 months:
 The CPC is currently predicting below average precipitation throughout NM during the monsoon July-August-September time frame.

Friday, March 01, 2013

Water Year

Now that it is March and the winter rains are almost finished, let's look at who got what.  The West remains in a deep drought.

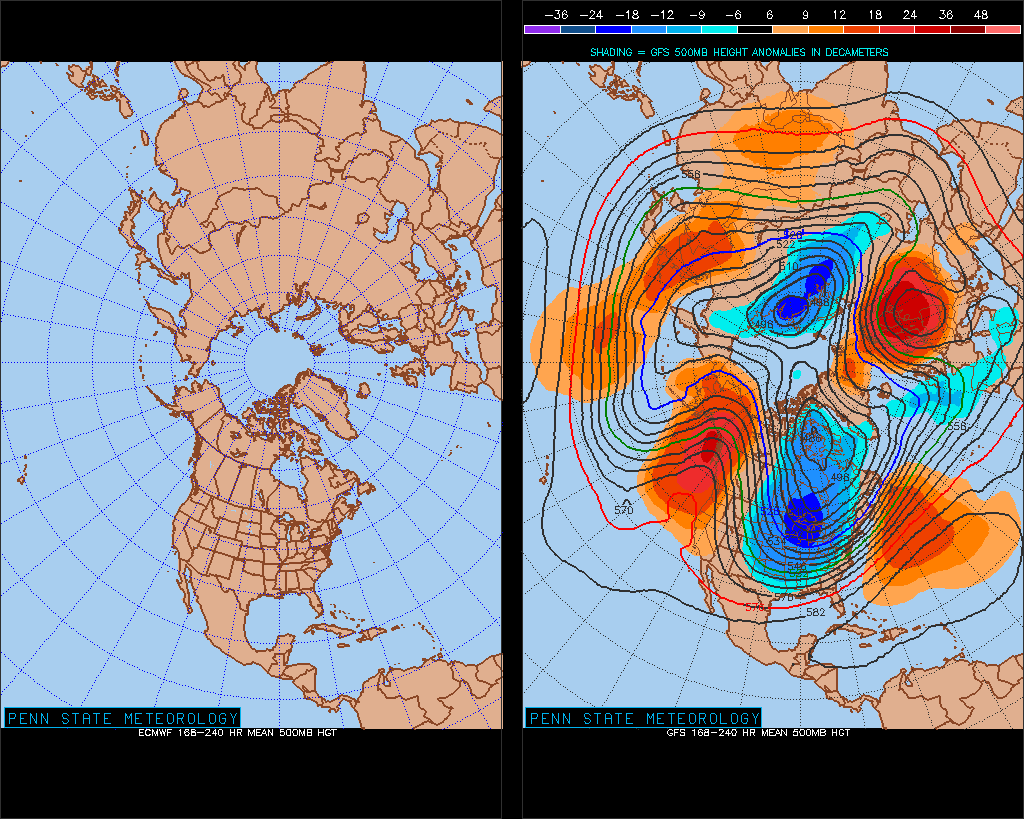
 Do Highs and Lows (e.g. 500mb height anomalies) force jet stream diversions or does jet stream bunching and coiling create ridge and troughs and hence Highs and Lows?


The Weather Channel notes that February upper-level (jet stream) synoptic pattern brought very cold air to the Eastern U.S.

Looking ahead to May, they predict that the continuing drought in the Western Plains will continue and set up a feedback loop: drier surface conditions will create a bubble of high pressure air that will in turn influence the average track of the jet stream, pushing storms north of the rain-starved regions.  This is just one possibility, however, and even then only reflects average conditions.

Monday, January 17, 2011

Pourbaix diagram

A Pourbaix diagram is used to show mineral solubility or metal valence, graphed on a Redox (Eh)/pH graph:

Monday, November 15, 2010

Vital Water and Homeostasis

1. Comparing Oxidative-Reductive Potential (ORP) and pH of various foods and drinks to human body fluids, Okouchi et al (2002). 2. The idea of renal net acid excretion (RAE) indicates that homeostasis in animals is mainained against the intake of heterogeneous substances.

1. Okouchi S, Suzuki M, Sugano K, Kagamimori S, Ikeda S. Water Desirable for the Human Body in Terms of Oxidation-Reduction Potential (ORP) to pH Relationship. Journal of Food Science. 2002;67(5):1594-1598.


2. Remer T. Influence of nutrition on acid-base balance--metabolic aspects. European Journal of Nutrition. 2001 October;40(5):214-220.

Monday, October 09, 2006

Top Ten Things To Do To Make Tucson Sustainable

(1) Harvest and conserve water
Step One:  Enjoy sponge baths or basin baths rather than showers.
Note:  A person can bathe in less than a quart of water this way!
At full sustainability Tucsonans will have cisterns, composting toilets, neighborhood water harvesting, and comprehensive water education.    

(2) Use the sun's energy
Step One:  Hang your laundry to dry in the sun.  
Note:  Some communities have restrictions against hanging out laundry.
At full sustainability Tucson will derive all its electricity and transportation from the sun's energy.
   
(3) Eat local and native foods
Step One:  Visit a farmers market.
Note:  Farmers Markets are listed in Tucson Weekly.
At full sustainability Tucson will have a City Food Policy to ensure access to healthy food for all Tucsonans.   Large daily farmers markets with bioregional products will supplement neighborhood food production and neighborhood desert food harvesting.  

(4) Work outdoors with neighbors
Step One:  Organize a neighborhood walk/doorknocking to discover neighborhood assets and what projects interest your neighbors.  
Note:  For tips on organizing neighborhood doorknockings, contact Pro Neighborhoods, (520) 882-5885.
At full sustainability every neighborhood will be safe for pedestrians and bicyclists, have a workable plan for emergencies which cares for all dependents, and engage in sustainable urban food production.
                 
(5) Ride bicycle or walk to your eco-village hub
Step One:  Identify your local commercial hub and do errands there without using fossil fuel; take public transit if your destination is further or you are physically challenged.
Note:  As you walk and bike your neighborhood you may notice places which need   shade trees.  These locations can become urban agriforestry projects.
At full sustainability Tucson will be organized into 60 to 80 complete eco-villages to which people can walk or bike.   These eco-villages will be connected by a safe comprehensive system of bike paths which do not mingle with auto traffic.

(6) Plant A Food Bearing Tree
Step One:  Dig a hole and bust through the caliche.  
Note:  This is more fun if you dig with friends and throw a party when the tree is planted.  Get hold of a caliche bar.  Contact Tucson Botanical Gardens or Tucson Organic Gardeners for best species of trees to plant in your location.
At full sustainability Tucson will be an edible urban forest.

(7) Save food scraps and compost with worms
Step One:  Build a simple home made "worm farm."  Many websites teach how, e.g.: www.earth911.org/master.asp?s=lib&a=organics/composting/wormcompost.asp
Note:  Worms create worm castings and worm juice which are rich plant food.
At full sustainability Tucson's home kitchens, restaurants and cafeteries will be connected by a comprehensive composting program.

(8) Grow food in home garden or community garden
Step One:  Contact Tucson's Community Food Bank or Tucson Organic Gardeners for information on how to grow food.
Note:  We can garden year round in Tucson.   Water is our limiting factor; therefore, water harvesting for gardening is crucial.   Sustainable Tucson highly recommends Brad Lancaster's book Rainwater Harvesting for Drylands, available at Antigone Books, Silverbell Trading, and through Sustainable Tucson in case quantities.
At full sustainability, Tucson and its bioregion will be mostly food self-sufficient.  

(9) Educate yourself and Tucson's representatives about sustainability. 
Step One:  Read the voter's guide for the upcoming election.   Who takes sustainable positions on solar and wind energy, mass transit, bike paths, water conservation?
Note:  Sustainability education is enjoyable in a group.  Our eco-zone potlucks are a wonderful way to share books, DVD's, videos, and ideaswith each other.  Why not start a group in your neighborhood?  Then invite a person running for office.
At full sustainability any school child will be able to tell a visitor to Tucson how our sustainable city works.

(10) Become an entrepreneur in the growing sustainable economy
Step One:  Identify your own art/passion/potential product or service.
Note:  Many entrepreneurs (self-employed people) market products and services. 
At full sustainability, Tucson (including its bioregion) will be mostly self-sufficient for water,
food, energy, and transportation.  Tucson's sustainable infrastructure will need to be planned, installed, and maintained by local businesses attuned to our city's terrain and culture.   Tucson will have a local credit clearing house which keeps our region's financial resources circulating locally.  

Written by Lindianne Sarno with Nicole Christine, Bob Cook, Tom Greco, and Joanie Sawyer.  
©Sustainable Tucson 2006.