Showing posts with label monsoon. Show all posts

Tuesday, September 28, 2021

2021 Arizona Monsoons

 It was a good monsoon in AZ this year, with some locations up 8 to 12 inches above normal (June-September 8).  But due to the uneven distribution of thunderstorms, even in this good year some areas barely received normal!


Friday, December 18, 2015

2015 New Mexico Weather Recap

The ABQ NWS office has an excellent recap of the state's weather over 2015.  For example, here is their summary of the summer monsoon:

The 2015 monsoon season got off to a quick start with heavy rainfall, floods, flash floods and severe weather in mid and late June, as well as the first two weeks of July.  A relatively quiet period ensued for most of the remainder of July. A resurgence of heavy rain returned from very late July through early August.  An outbreak of severe weather was the dominate weather story in mid August, and to a lesser extent on September 9th and 23rd. 
products issued during monsoon season
By the numbers:  The Albuquerque NWS office issued 53 flash flood warnings between June 15 and September 30. 

The biggest news of the year was probably the good precipitation that finally ended the drought that began in early 2011:

Drought conditions developed across New Mexico in early 2011, with few breaks in the drought through 2012, such that much of the state was gripped in the worst drought episode since the 1950s.  Near normal statewide precipitation in 2013 and 2014 did little to improve the drought.  Much of the precipitation in 2013 and 2014 fell during the monsoon season, rather than the much more needed winter mountain snowpack.
Finally, New Mexico precipitation in 2015 was above normal for much of the year, and the period January through November was the fifth wettest on record since 1895.  As shown in the graph to the right, precipitation in New Mexico was well above average in January, May, July and October, with only two months below average - August and September.  These wetter than normal conditions supported a steady reduction in the intensity and coverage of the short term drought.  Finally, in early December 2015 New Mexico was drought free!  The last time the state was without any drought status was the week of November 23, 2010!
By the numbers:  New Mexico went 263 weeks with a portion of the state in moderate or worse drought!
NM monthly precipitation for 2015
  
 percent of new mexico in drought since 2011
 Source: U.S. Drought Monitor

Friday, October 02, 2015

2015 Summer Monsoon Totals


The NWS maintains a report of monsoon totals for the ABQ metro area.
Percent of normal monsoon moisture received in July, August, and September 2015.

Moisture during the summer was spotty, but usually above average.

Friday, September 05, 2014

Review of Soil Moisture Measurement Techniques


Advances in efficient, broad measurement of soil moisture are needed to understand plant stress response to drought.  Crop growth and phenology can be predicted (link) with accurate modeling of soil-plant-atmosphere interactions.  These dynamics are also crucial for advances in meteorology, since most rain that falls in the U.S. is recycled rain that has already fallen and evaporated at least once before, but often several times.  Accurate prediction of rainfall will continue to elude meteorologists until soil moisture can be measured and predicted.

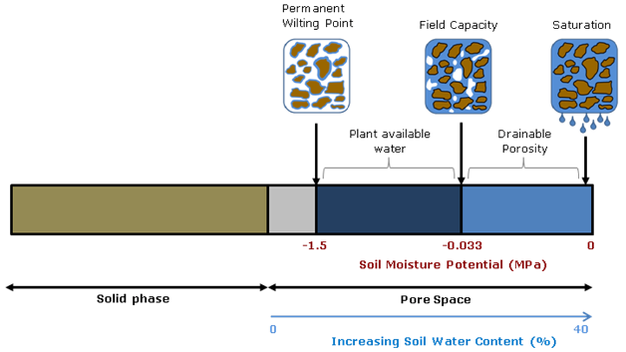
Soil moisture is critical for advancing plant and atmospheric sciences,  but the fact that different measurement techniques yield different values points to the fact that soil moisture is essentially an abstract idea.  While the water content of soil would seem to be straightforward, whether you calculate volumetric or gravimetric water content, and whether you consider chemically- and physically-immobilized water or only plant-available water (field capacity minus permanent wilting point) matters a great deal.


Diagram source.

Spatial and temporal scale also matters.  Do you want an instantaneous point measurement, or a daily weekly average for an entire county’s drought status?  Picking the right tool for the job means understanding the streghths and weaknesses of the entire gamut of technologies capable of reporting soil moisture.  This article will start with traditional in situ point measurement techniques and continue to review broad-scale soil moisture modeling and remote-sensing efforts.


from Shuttleworth 2013

Small-scale measurement can be accomplished using point-sampling with portable soil moisture probes, such as TDR and traditional (active) neutron probes.  Of course, any discussion of soil moisture measurement techniques would be incomplete without mentioning the gravimetric method, or simply weighing a soil sample wet and then dry.  But as with the other point techniques, this method can only measure hyperlocal conditions and must be replicated and averaged to inform landscape-scale management.

TDR, or time-domain reflectometry, uses the electrical properties of soil and water to calculate volumetric percent soil moisture.  For most soils, excluding those with very high organic matter (OM>10%), the TDR method without calibration provides water content in the range from zero to 50% with accuracy better than 1-2%.  While calibration and new TDR such as TRIME-TDR can improve accuracy by a factor of 10-100, the amount of microscale variability in soil means that these point measurements must be replicated dozens to hundreds of times to build up a picture of average site moisture. Microvariability can be important when precipitation preferentially flow along soil heterogeneities such as roots, textural changes, and bioturbation pathways.    Buried probes that use the TDR techniques, such as the Stevens Hydroprobes I used in my graduate research, are fixed in place and are therefore severely limited by their inability to average site variability.
  
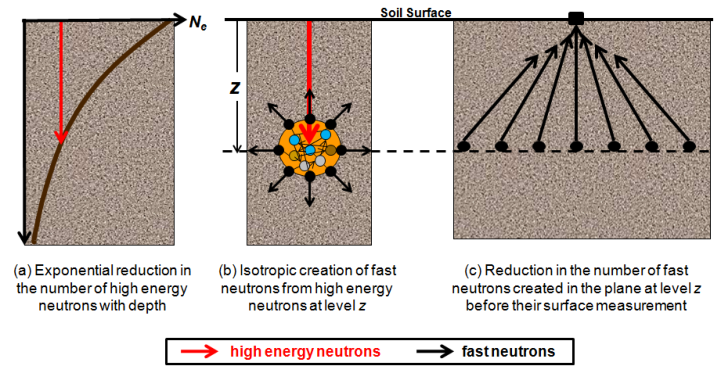
Traditional neutron probes work by bombarding the soil with high-energy neutrons and recording the number of neutrons emitted by the soil.  Hydrogen absorbs neutrons so the amount of H2O can be calculated.  This technique solves many of the problems of TDR, but the sensors are expensive and the measurement still must be repeated several times to measure field soil moisture.  

-

Meso-scale measurement can now be accomplished using the new COSMOS (Cosmic-ray Surface MOisture Sensor) program to measure whole ecosystem moisture.  Neutron moisture probes have been around for decades but COSMOS uses advances in particle-physics technology to increase sensitivity enough to rely solely on the background cosmic radiation as a uniform source of neutrons.  This advance makes possible, for the first time, instantaneous field-scale measurement of soil moisture.


These new sensors were originally deployed in 2010. They have the potential to revolutionize studies of soil moisture because they are the only technique to measure soil moisture at scales between the hyper-local point measurements and the kilometer-swaths of satellites.  They also are the only soil moisture probe that can account for water stores in living tissue.  According to Hydroinnova, one company that makes these $10,000 units, the measured soil footprint is 86% within 350 meters and the effective measuring depth changes with soil moisture, from a maximum of 70 cm in completely dry soil, to a minimum of 12 cm in saturated soil. 


Source.
While these sensors are few in number and relatively widely dispersed, they offer a whole new picture of soil moisture at the landscape level.  They are the only truly effective direct measure of soil moisture at the hectare level, and can be used to better calibrate the informational products discussed below.  However, as with all techniques, COSMOS must also be calibrated to take account of different soil types and changes in vegetation.

-

Large-scale measurement of soil moisture can be accomplished using proxies, satellites, models, or some combination of techniques.

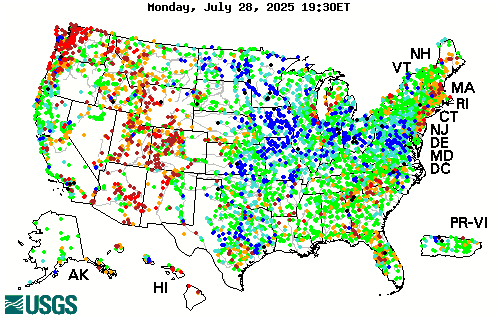
River flow data can reveal how much water is running off or through the soil from watersheds, so using a site like the USGSstreamflow network is a good proxy for large-scale short-term drought and deluge.


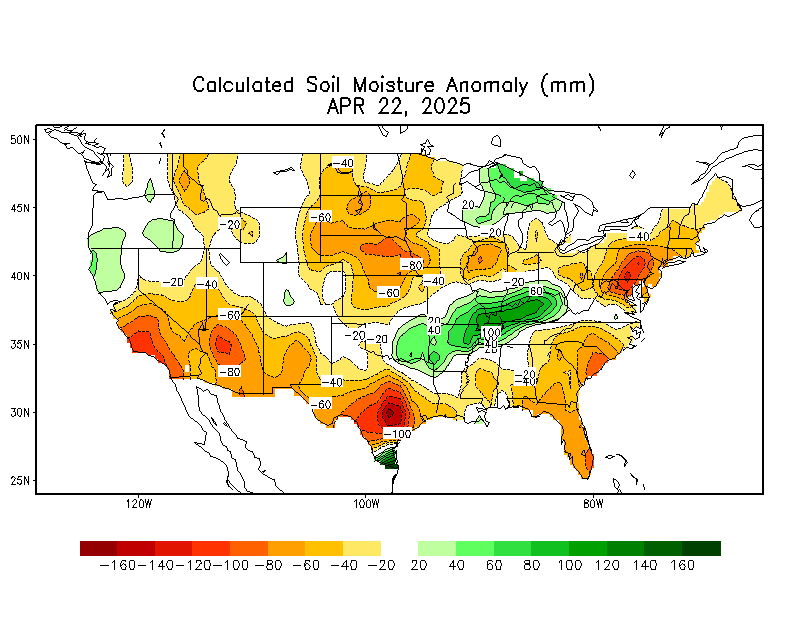
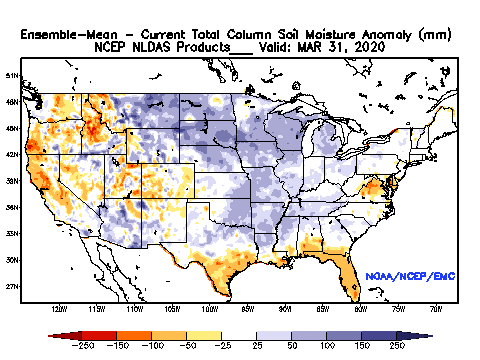
The current best methods for estimating large-scale soil moisture are the Drought.gov model products, which include the Palmer Drought Severity Index, soil moisture index, etc.  The Calculated Soil Moisture Anomaly is calculated based on observed precipitation and temperature.  Soil moisture, evaporation, and runoff for the entire US and globe are then modeled based on observations from a small area of eastern Oklahoma.  While this method is clearly biased, it is the best available.

The National Land Data Acquisition System is developing a more accurate model of soil moisture that incorporates soil textural properties and average percent vegetation (which impacts evapotranspiration).  The precipitation data used in the model is at approximately 25km resolution, interpolated to 13km grid cells:


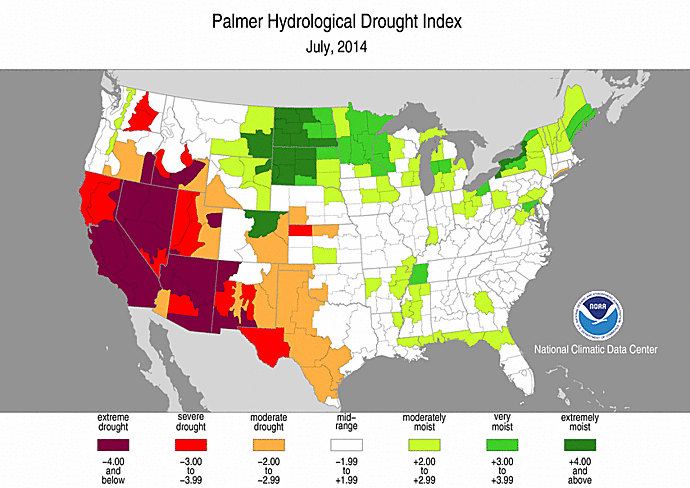
Palmer Drought Indices are similar to soil moisture models in that precipitation, evapotranspiration, and runoff are used to calculate remaining water balance.  There are long-term (Palmer Drought Index (PDI) and Palmer Hydrological Drought Index (PHDI) indices that measure changes in groundwater and reservoir levels, and short-term indices (Palmer Z Index and Crop Moisture Index (CMI)) that affect agriculture during the growing season.


 Interestingly, the US Drought Monitor, which looks essentially like one of the Palmer indices, is subjectively drawn using “a blend of science and subjectivity”.


Monday, August 25, 2014

Good Monsoons so far in New Mexico!

Almost the end of August and the climatological "monsoon" in the Southwest should be wrapping up around the first or second week of September. The last two months of rains have been sporadic, but significantly above average in the Land of Enchantment. Most areas in central NM are above 150% of normal for the season, and there are many areas that have tripled their average summer rainfall!

Friday, July 11, 2008

The Monsoon has begun (in Tucson)

The monsoon has begun in Tucson:
Source.This NOAA graph shows dewpoint, a measure of humidity. The blue line for this year is above the average, red line, and passed the 54 degree cutoff in early July. The monsoon is somewhat arbitrarily defined as any period of three or more consecutive days when the dewpoint is 54 degrees or above. In Tucson this kind of moisture only happens during the monsoon, when the wet tropical air pushes north. More info.

The rainfall so far has been above average as well. This graph does a good job of showing the variability of rainfall between cities that are less than 100 miles apart. When it comes from isolated thunderstorms, sometimes they hit you, sometimes they miss you.

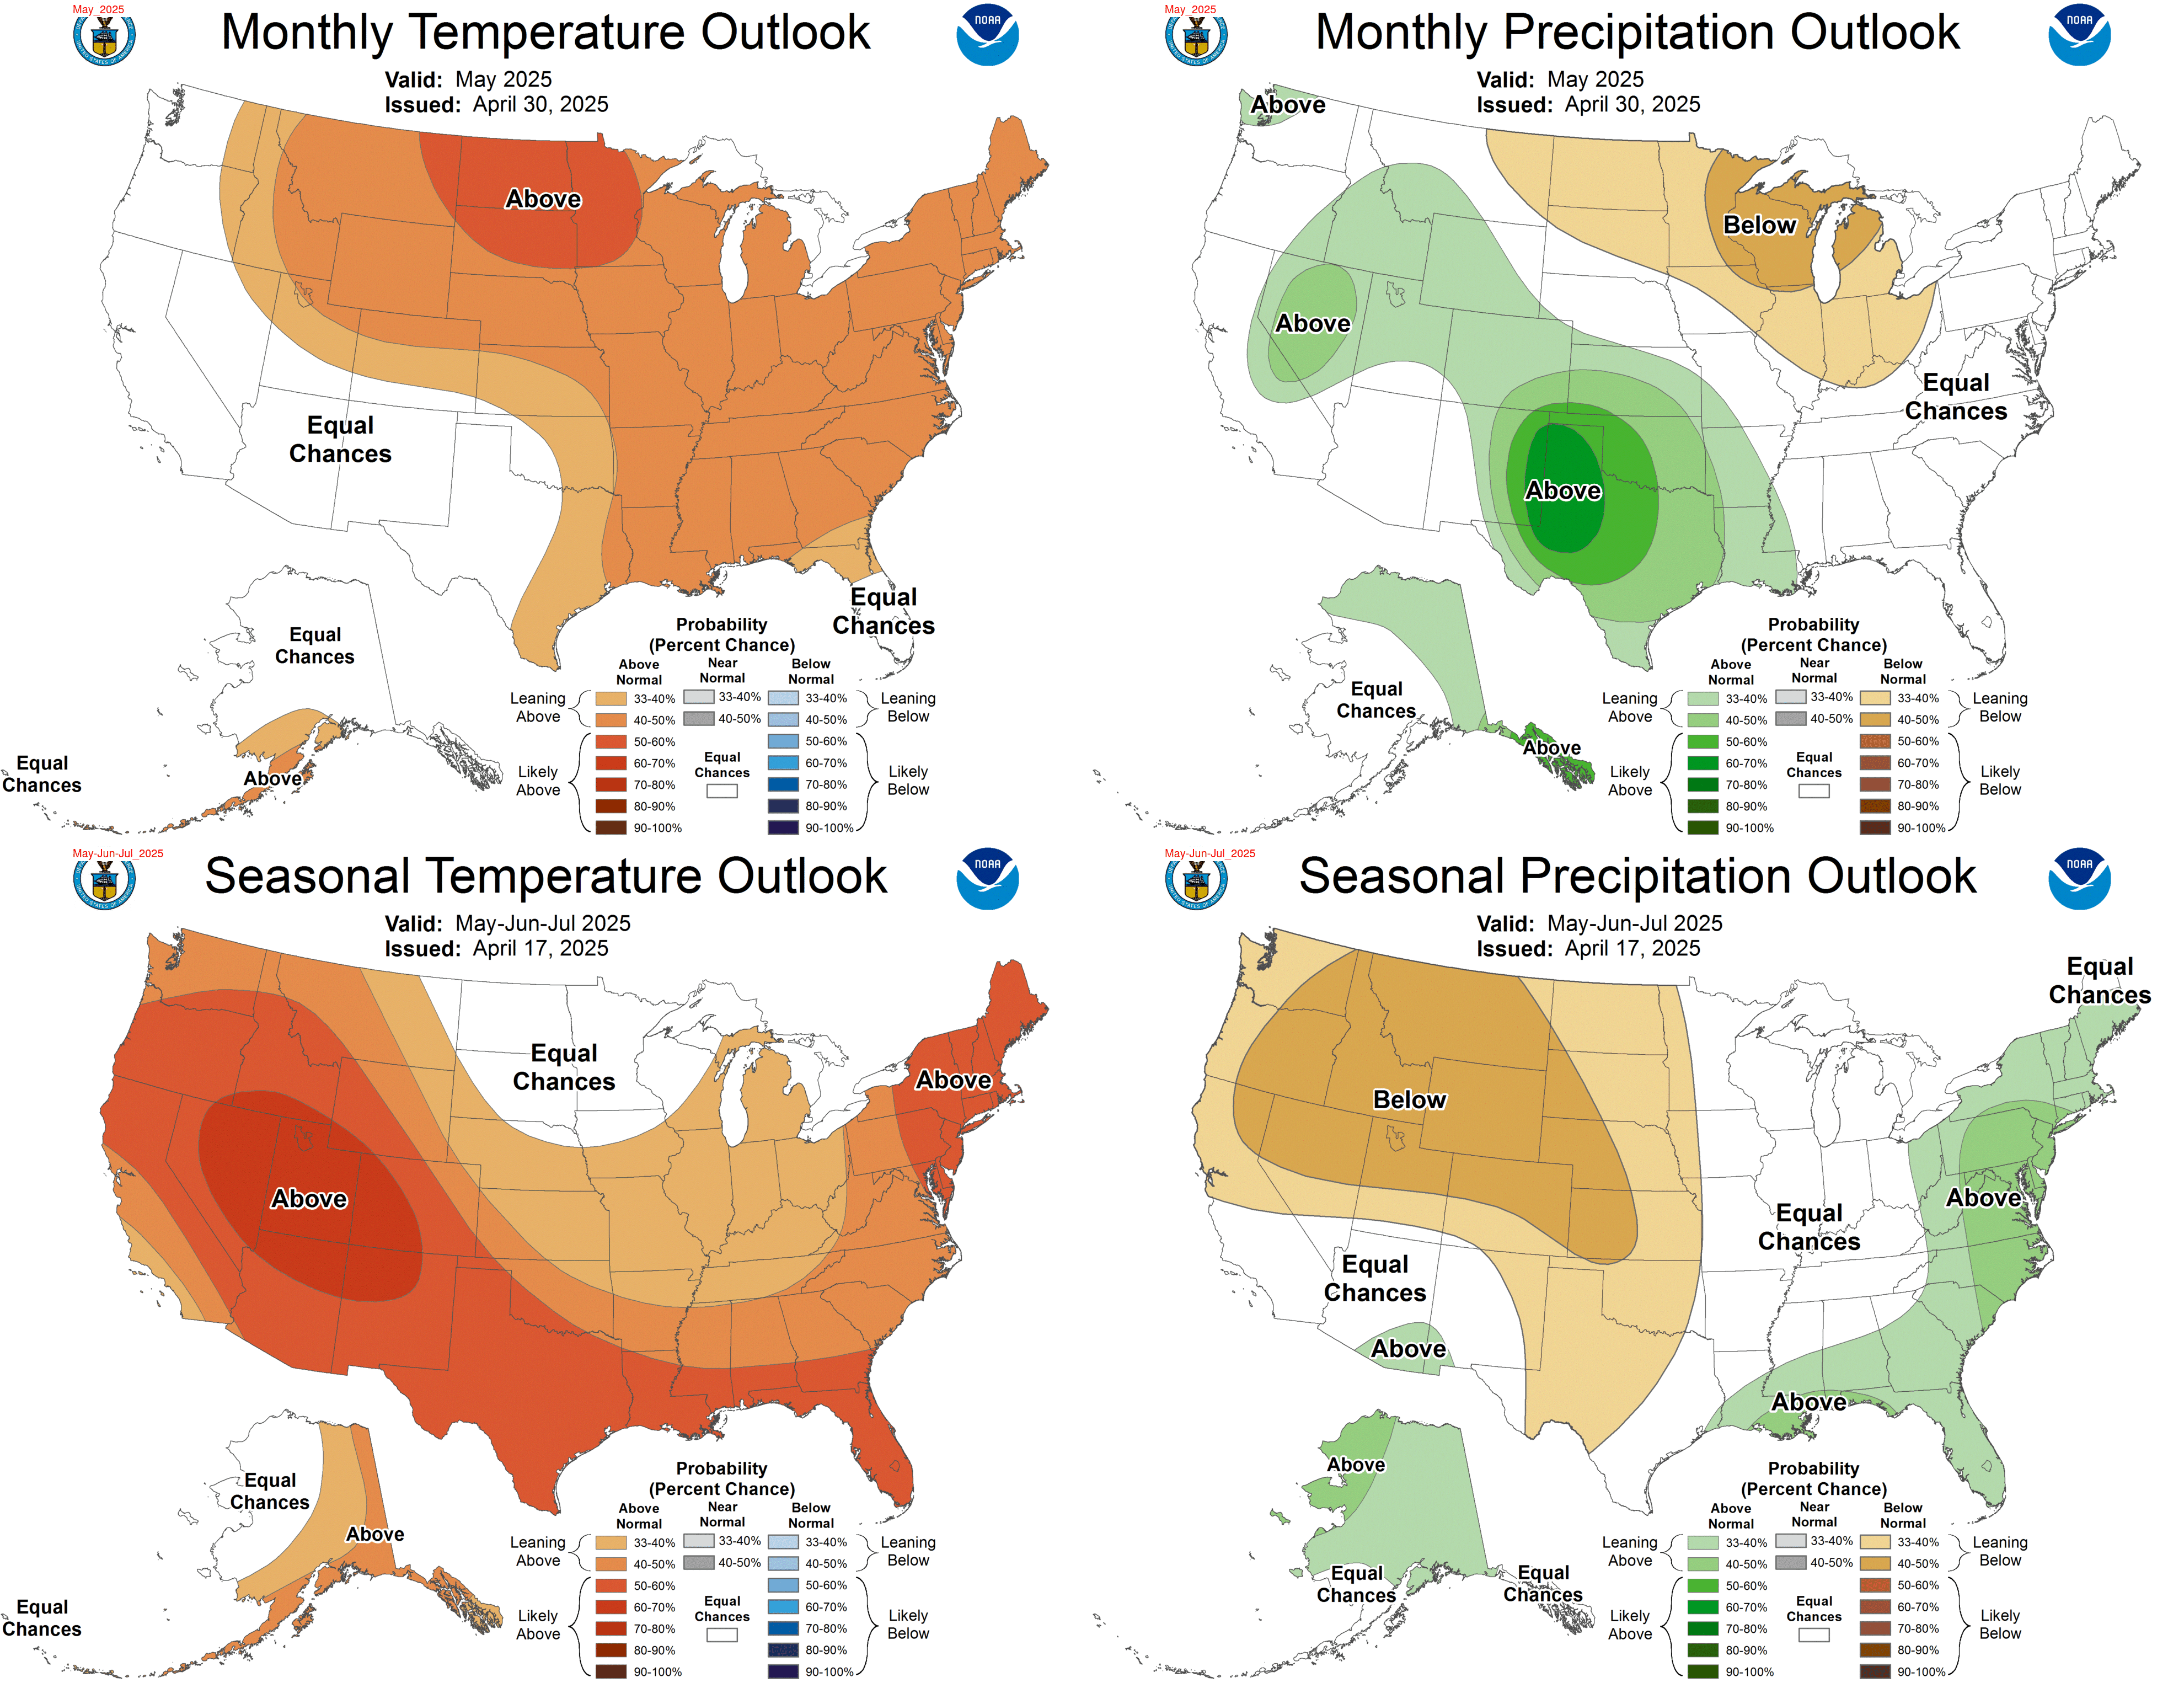
The rain has not yet helped out New Mexico and Texas (source), but the climate forecast is for New Mexico to get a good amount of moisture over the next month:
Source.