Showing posts with label species. Show all posts

Saturday, January 31, 2026

DNA Barcodes, Klee Diagrams, and the Secrets of Speciation

Modern biodiversity detectives have found new ways to synthesize massive amounts of sequence data into clear information and insights. Two powerful tools to help visualize and understand the structure of life are DNA barcodes and Klee diagrams. Mark Stoeckle and David Thaler pioneered the use and explanation of these tools to offer insights into how species originated and evolved.

What is a DNA Barcode?

A DNA barcode is a short, standardized segment of the genome used for species identification. In the animal kingdom, the gold standard is a 648-base pair (bp) segment of the mitochondrial cytochrome c oxidase subunit I (COI) gene. While this segment represents less than one-millionth of an organism’s total genome, it has proven remarkably effective because mitochondrial DNA clusters largely overlap with species as defined by experts.

This tool is commonly used in eDNA samples to identify species from the environment. The BOLD (Barcode Of Life Database) now contains approximately five million of these barcodes, covering about 100,000 animal species. Interestingly, there is nothing inherently “special” about the COI gene biologically; it became the standard because reliable primers were adopted by a critical mass of the scientific community.

Visualizing Life: The Klee Diagram

To make sense of these millions of sequences, scientists developed the Klee diagram, a heat map that displays correlations between DNA sequences. In these diagrams, every sequence is compared with every other sequence, and the intersections are color-coded to show similarity. (Sirovich, Lawrence, Mark Y. Stoeckle, and Yu Zhang. “Structural analysis of biodiversity.” PLoS One 5.2 (2010))
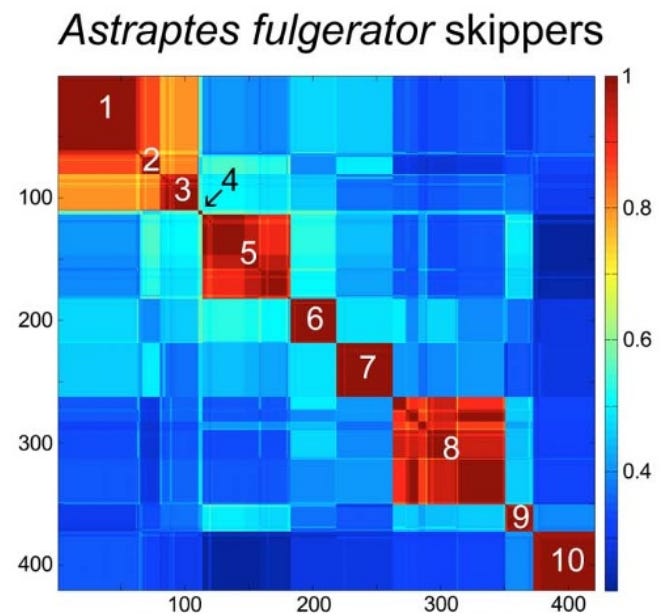
Species-level clusters in skipper butterfly Astraptes fulgerator COI barcode Klee diagram. Sequence clusters appear as blocks of high correlation along the diagonal and correspond to the 10 provisional species (1. INGCUP, 2. HIHAMP, 3. FABOV, 4. BYTTNER, 5. YESENN, 6. LONCHO, 7. LOHAMP, 8. SENNOV, 9. CELT, 10. TRIGO). Block sizes reflect number of sequences per species (n 3–88). Stoeckle and Coffran 2013.

Key features of Klee diagrams include:

• Indicator Vectors: Each DNA sample is listed on both the x and y axis and a heat map is generated comparing each species to itself (red=1, a perfect match) and all of the other samples in the database.

• Species Islands: When sequences are arrayed, species appear as sharp, non-overlapping squares. This visualization confirms that species are “islands in sequence space,” with distinct clusters and empty gaps between them.

• Scalability: Recent software developments like PyKleeBarcode allow these diagrams to be computed for very large datasets, potentially representing the whole animal kingdom in a single information space.
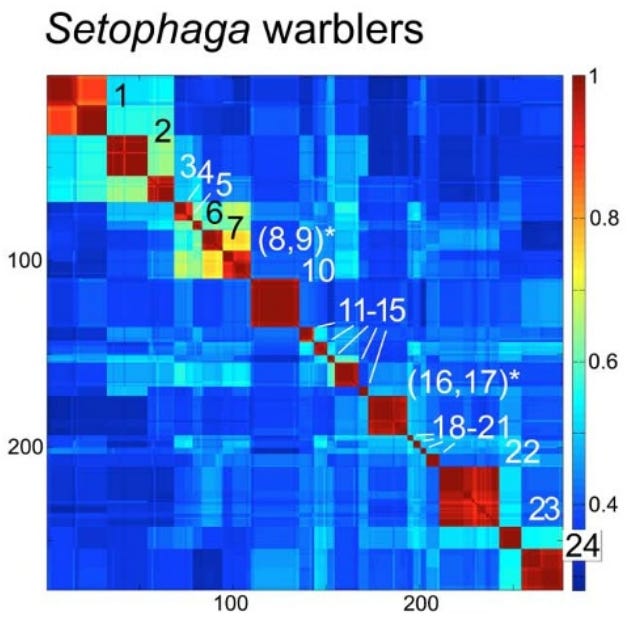
Species-level clusters in birds: Setophaga warblers COI barcode Klee. Blocks along the diagonal correspond to species; species with shared blocks are marked with an asterisk (1. petechiae, 2. striata, 3. pensylvanica, 4. nigrescens, 5. graciae, 6. discolor, 7. virens, 8. occidentalis,* 9. townsendi,* 10. magnolia, 11. tigrina, 12. castanea, 13. dominica, 14. palmarum, 15. citrina, 16. americana,* 17. pitiayumi,* 18. cerulea, 19. pinus, 20. kirtlandii, 21. fusca, 22. coronata, 23. caerulescens, 24. ruticilla). Stoeckle and Coffran 2013.

Evolutionary Implications: Why Mitochondria Define Species

A long controversy in biology concerns whether species are “real” or just human constructs. Dobzhansky, in his 1937 book Genetics and the Origin of Species, claimed that “Biological classification [of species] is simultaneously a man-made system of pigeonholes devised for the pragmatic purpose of recording observations… and an acknowledgement of the fact of organic discontinuity.”

Stoeckle and Thaler, in their 2018 paper “Why should mitochondria define species?”, expand on the evolutionary meaning behind these barcode clusters. They argue that the patterns seen in DNA barcodes are central facts of animal life that evolutionary theory must explain.

1. The “Barcode Gap” and Low Intraspecific Variation: Across the animal kingdom, the average pairwise difference (APD) within species is typically very low, between 0.0% and 0.5%. Meanwhile, the distance between even the most closely related species is usually 2% or more. This “gap” exists because intermediates between clusters are absent or rare.

2. The Neutrality of Synonymous Mutations: Most variation within and between these barcode clusters consists of synonymous substitutions; mutations that change the DNA sequence but not the resulting protein.

Stoeckle and Thaler argue that these changes are selectively neutral in mitochondria. This is because animal mitochondria are simpler than the nuclear genome; they lack introns (and thus splicing) and only have 22 different tRNA types. This lack of complexity means synonymous codons are less likely to affect the “fitness” of the organism, allowing them to accumulate as a “molecular clock”.

However, observed patterns of variation in DNA barcodes do not match the predictions of Kimura’s Neutral evolutionary theory of random accumulation of mutations.
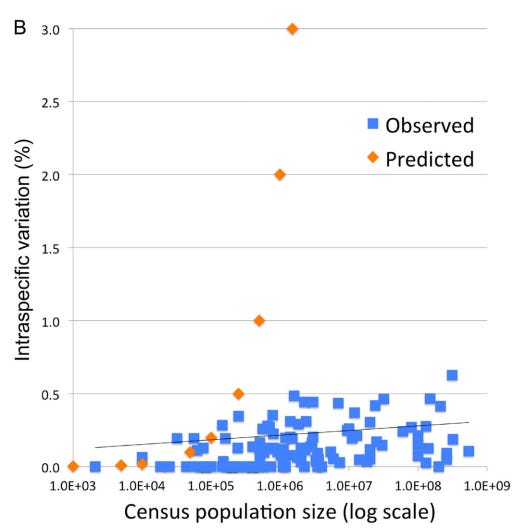
Intraspecific variation and population size among 111 bird species with census estimates; species with geographic or hybrid clusters were excluded. Orange markers indicate predicted variation for a model species under neutral evolutionary drift. Stoeckle and Thaler 2014.

3. A Recent Universal Expansion? To reconcile these observations, Stoeckle and Thaler’s use humans as a case example. Modern humans have an APD of 0.1%, which is about average for the animal kingdom.

Several lines of evidence suggest that human mitochondria originated from a state of uniformity approximately 100,000 to 200,000 years ago before expanding. Stoeckle and Thaler propose that the extant populations of humans, and almost all other animal species, arrived at a similar result due to a similar process of expansion from mitochondrial uniformity within the same recent geological timeframe.
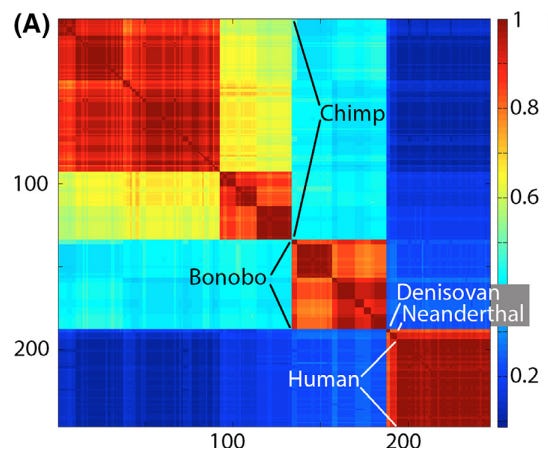
Klee diagram of mitochondrial genetic diversity of humans and our closest living and extinct relatives. The human sequences represent the span of known modern diversity. The Klee diagram heat map demonstrates greater mitochondrial diversity among chimpanzees and bonobos than among living humans. Thaler and Stoeckle 2016.

This coincides with Mayr’s 1942 idea that bottlenecks followed by expansion could explain speciation:

“The reduced variability of small populations is not always due to accidental gene loss, but sometimes to the fact that the entire population was started by a single pair or by a single fertilized female. These “founders” of the population carried with them only a very small proportion of the variability of the parent population. This “founder” principle sometimes explains even the uniformity of rather large populations…”
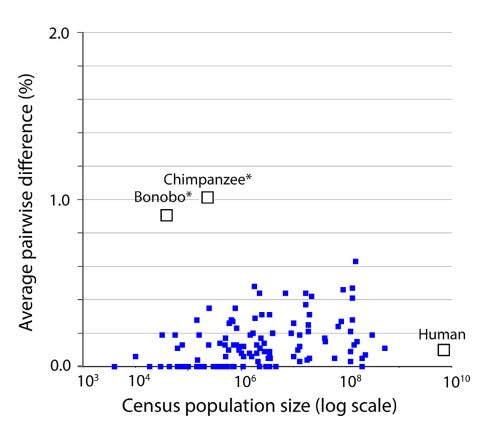
Mitochondrial genetic diversity, represented as average pairwise difference of COI barcodes, in relation to census population size in humans, chimpanzees, and bonobos compared to a well characterized set of birds (Stoeckle and Thaler 2014). Mitochondrial genetic diversity in humans is about 0.1%, less than that of many bird species, despite having more than 10-fold greater population than the most abundant bird in this dataset. Chimpanzees and bonobos have much smaller population sizes than humans, but conspicuously higher diversity, consistent with reproductively isolated subgroups. Thaler and Stoeckle 2016.

Conclusion

DNA barcodes and Klee diagrams do more than just identify species; they reveal a kingdom-wide pattern of organic discontinuity. Whether through population bottlenecks, lineage sorting, or gene sweeps, the uniform low variance across species suggests that the “islands” of biodiversity we see today are the result of deep evolutionary currents that affect all animals—from humans to birds to insects—in a surprisingly similar way.

Thaler and Stoeckler conclude their 2018 paper by noting that “there is irony but also grandeur in this view that, precisely because they have no phenotype, synonymous codon variations in mitochondria reveal the structure of species and the mechanism of speciation.”

Annotated Bibliography

Sirovich, Lawrence, Mark Y. Stoeckle, and Yu Zhang. “Structural analysis of biodiversity.” PLoS One 5.2 (2010): e9266.

- lays out math and originally defines “Klee diagrams”. Some examples.

Stoeckle, Mark Y., and Cameron Coffran. “TreeParser-aided Klee diagrams display taxonomic clusters in DNA barcode and nuclear gene datasets.” Scientific Reports 3.1 (2013): 2635.

- short and sweet version for Nature. Butterly and Warbler Klee examples.

Stoeckle, Mark Y., and David S. Thaler. “DNA barcoding works in practice but not in (neutral) theory.” PLoS one 9.7 (2014): e100755.

- first paper to note that the observed patterns in Klee diagrams, of homogenous species, doesn’t match neutral theory. OK.

Thaler, David S., and Mark Y. Stoeckle. “Bridging two scholarly islands enriches both: COI DNA barcodes for species identification versus human mitochondrial variation for the study of migrations and pathologies.” Ecology and Evolution 6.19 (2016): 6824-6835.

- short but good paper, cool data on humans, bonobos, and chimps, and comparison to results from their 2014 paper disproving neutral theory. Human/Chimp Klee example.

Stoeckle, Mark Y., and David S. Thaler. “Why should mitochondria define species?.” BioRxiv (2018): 276717.

- deep dive analysis that builds on 2014 observation that mitochondrial DNA barcodes don’t match expectations of neutral theory (”Species are islands in sequence space.”), while at the same time appearing to be created by neutral (synonymous) sequence changes. This is explained by evolutionary mechanisms of speciation, which has implications for how recent most species have become species. These results also help to resolve some of the disagreements about the definition of a species.

Duchemin W, Thaler DS (2023) PyKleeBarcode: Enabling representation of the whole animal kingdom in information space. PLOS ONE 18(6): e0286314.

- methods paper

Tuesday, November 15, 2022

Introduced versus Native Species

 Like almost all categories in nature, there are exceptions and ambiguities. 

How do we really know a species is non-native?  It might seem like an obvious category, but if you think about it, the "evidence" of absence before a certain date is just absence of evidence!  I know taxonomists who don't agree that certain species, widely regarded as non-native, are actually non-native.  They just think the species was under-collected before a certain date.  This is especially true when there is no strong ecological or geophysical reason for the species not to have spread naturally.  For example, species that are "native" to Eastern North America, but are considered "Introduced" in Western North America (e.g. American Bullfrog).

What about species that have both native and introduced genotypes?  Phragmites australis is a classic example from North America, where you have to ID to subspecies (often very difficult) to distinguish the native from invasive.  In iNat, if you only ID to species, it will say it is native.  Only the observations that have been ID'd to species have the Introduced tag. 

Other categories include:

Archaeophytes: plants which were probably introduced by humans to an area, but the introduction happened a very long time ago, and evidence is usually indirect. Most introductions before AD 1492 would fit in this category.  

Neo-natives: This is a rather new term denoting species that settle without human assistance in a new region (see Essl et al. 2019).  For example, range expansions due to global warming.  


More discussion:  https://forum.inaturalist.org/t/residency-status-for-archaeophyte-and-neo-native-plants/37252

Wednesday, October 26, 2022

Upcoming Endangered Species Listing Decisions in Arizona 2022-2027

I found a 5-year workplan on the USFWS site and made a list of all of the AZ species that USFWS will make listing determinations for. 

Its pretty interesting to look at what’s coming up.  Lots of talussnails!  But after the Sonoran desert tortoise (which they decided not to list), I think the next big one is the Monarch butterfly.  

Also interesting that there’s no bumble bee species on this list, as I know they’ve been petitioned.  Of course, this could all change as new species are added to the candidate list and priorities change...


FY22

Sonoran desert tortoise

-widely distributed in AZ deserts

- listing decision spring 2022: not warranted


Cactus ferrugous pygmy owl 

-by end of calendar year

https://www.inaturalist.org/taxa/237012-Glaucidium-brasilianum-cactorum

https://www.audubon.org/news/this-tiny-desert-raptor-could-soon-regain-federal-protection


roundtail chub


gray wolf (western populations)


FY23

Joshua tree 


Quitobaquito tryonia


FY24

Monarch butterfly

-widely distributed in AZ

A listing proposal is anticipated by November 2023, with a final listing decision by end of Federal FY2024 (September 2024). 


Las Vegas bearpoppy Arctomecon californica


Pinaleno talussnail Sonorella grahamensis

San Xavier talussnail Sonorella eremita


FY25

Ferris's copper butterfly Lycaena ferrisi

https://www.inaturalist.org/taxa/1360320-Tharsalea-rubidus-ferrisi

ASNF southwest of Springerville


Chisos coral-root Hexalectris revoluta

Sky island mountains


Threecorner milkvetch  Astragalus geyeri var. triquetrus


Grand Wash springsnail Pyrgulopsis bacchus

Kingman springsnail Pyrgulopsis conica


FY26

Arizona toad Bufo microscaphus microscaphus

- widely distributed in AZ

https://www.inaturalist.org/taxa/64982-Anaxyrus-microscaphus


Navajo bladderpod Lesquerella navajoensis

- habitat on Navajo Nation


Yuman Desert fringe-toed lizard Uma rufopunctata


Mojave poppy bee    Perdita meconis 


Bylas springsnail Pyrgulopsis arizonae

Gila tryonia Tryonia gilae

Huachuca woodlandsnail Ashmunella levettei


Squaw Park talussnail Maricopella allynsmithi

-populations are on city or county parks in the Phoenix metro area https://explorer.natureserve.org/Taxon/ELEMENT_GLOBAL.2.114155/Maricopella_allynsmithi


Verde Rim springsnail Pyrgulopsis glandulosa

https://www.inaturalist.org/taxa/111425-Pyrgulopsis-glandulosa


FY27

Morton's wild buckwheat  Eriogonum mortonianum


Pipe Springs cryptantha    Cryptantha semiglabra


Source: https://www.fws.gov/media/national-listing-workplan-fiscal-years-2022-2027

More USFWS lists:  https://ecos.fws.gov/ecp/species-reports

Thursday, September 22, 2022

Mapping Species Habitat with Appropriate-Sized Buffers

 Previously, I wrote that this Story Map shows small polygons of habitat as buffers around representative observations.  However, the actual locations are not accurate because the underlying observation data has been randomized to protect populations of rare species. 


The first map ("Preliminary Conservation Zones" and "Potential Dispersal Zones" for the American, Rusty-patched, Suckley's, and Western bumble bees) shows the correct kind of critical habitat (buffered observations) USFWS has designated for rusty patch and would likely designate for other proposed species, but the locations are incorrect.  For example, the mapped locations of Rusty patch on that map do not line up to the USFWS GIS for rusty patch critical habitat. 


Some of the other species may be are incorrect as well, depending on whether the data source (GBIF) considers the species endangered and so randomized the locations within a 0.2 degree lat/long box.  That seems to be the case for the Western Bumble bee, but not the American bumble bee. 


The map shows a mix of accurate and inaccurate, specific habitat points. This is confusing and potentially misleading, if the intent is to facilitate conservation planning.  For example, when I zoom to an area of interest, I might think there is no mapped habitat there. But if there is some nearby, I can't tell from if that habitat is or isn’t within my area of interest.


The easiest fix would be to increase the size of the buffers so that they include the entire randomized area (0.2 degree, lat/long) that each point comes from.  A note could say that critical habitat would likely be designated in a subset of those larger polygons based on the buffer size USFWS decides.

Thursday, September 15, 2022

Mitigation Banking Could Transform the Endangered Species Act

 The Clean Water Act (CWA) --despite its ambiguities-- has the important provision of acre-for-acre wetland mitigation. In other words, the CWA ensures No Net Loss of protected wetlands.

The Endangered Species Act (ESA) --despite controversies over Critical Habitat-- has no automatic provision of no net loss of protected species habitats. Instead, it relies on bespoke mitigations on a project-by-project basis. Most projects are approved with incompletely mitigated impacts to species and their habitats. The result is continual loss of habitat.

Current proposed changes to habitat mitigation could help make ESA more like CWA, moving the ESA toward No Net Loss of habitat. The result would be improved regulatory certainty for projects, mitigation banking opportunities for conservation investors, and better outcomes for listed species.

Environmental Policy Innovation Center's Becca Madsen has more excellent & detailed analysis.

Thursday, December 24, 2020

Habitat in the Endangered Species Act


Response to Jake Li's response to FWS revised definition of "habitat".

A couple of points about critical habitat.  First, it is often not stated by those who understand the ESA, and often misunderstood by those who do not, that critical habitat designations only have regulatory force on federal lands or for projects that involve a federal nexus (such that a federal agency would consult with FWS). While this may seem like nitpicking, it is crucial to understand the regulatory impact of the change in definition, as many federal agencies do not rely exclusively on critical habitat designations but instead consult with FWS based on the SME of their biologists whenever a project may impact a listed species.  

For private land, where many people are most worried about critical habitat, any changes in the areas designated would have little to no impact due to the fact that critical habitat has little to no impact on private land.

Second, it is interesting to consider how this change in the definition of habitat would affect monarchs. I think it would not affect monarch habitat due to the inclusion of "ephemeral and seasonal habitat" in the definition.  Even if monarchs only inhabit an area for a few months of the year, that area could still be designated critical habitat. 

You write that the 7a habitat protection is redundant if an area is occupied (and therefore protected by the jeopardy prohibition).  But monarchs (and many other species) only seasonally occupy parts of their critical habitat, so the 7a protection will continue to be relevant in those cases. 


---

Thoughts about possible monarch listing:


Planting milkweed habitat

Some people are afraid of creating milkweed habitat because apparently they think they would never be able to destroy or modify this habitat.  I find this unlikely.  More likely is that they would be restricted from destroying or modifying the habitat while monarch caterpillars are present.  During winter months, they could destroy this habitat without adversely affecting individual monarchs.  Habitat protection in the ESA is often misunderstood on this point.


CCAA

I assume that monarchs will be listed.  Even so, there are many reasons for not joining CCAA, but I will focus on reasons that FWS enforcement will not be detrimental to business operations at companies with well-developed IVM programs.

A mature IVM program already has the goal to move away from mowing/mastication toward spot treatment of incompatibles with herbicide.  Although there will need to be mowing in some areas, the reason for mowing is that the areas are overgrown with woody vegetation. Therefore these areas would not support monarch milkweed habitat.

There may be incidental work in monarch milkweed habitat, but most of this work would not impact monarch breeding. For example tree cutting. I consider it unlikely the FWS would broadly restrict all activities in monarch milkweed habitats, due to the vast and unenforceable impact this would have on ordinary activities across the country.

I believe FWS will restrict some activities that would impact monarch milkweed habitat, during the monarch breeding season, especially ground-disturbing activities.  Biological opinions for species impacted by ground disturbing work implement mitigation measures that include timing restrictions and crew trainings.  FWS has provided incidental take statements based on these mitigation measures and reporting requirements.  I expect a similar scenario when monarch are listed. 

Monday, May 11, 2015

San Diego T & E Species

The U.S. Fish and Wildlife Service has a new website to identify species of conservation concern.  This system is easy enough that anyone can search for and learn about the Threatened and Endangered species in their county.

 For example, here is the list for San Diego County, California:


Sunday, November 23, 2014

"Fewer than 5,000 remain"

The U.S. Fish and Wildlife Service recently listed the Gunnison Sage Grouse as "Threatened" under the Endangered Species, act, one step shy of being actually "Endangered".  The ESA specifically prohibits killing a species listed as Threatened or Endangered.


The outcry has been significant, to the point that the Colorado Governor (a Democrat) is preparing a lawsuit in opposition. (Durango Herald)

Only a few scattered subpopulations currently remain out of the historic vast swath of occupied habitat.  Source: WildEarth Guardians Species Fact Sheet


The largest population, in the Gunnisun Basin, appears to be stable and not at risk, but many of the subpopulations continue to shrink.  Source:  USFWS Fact Sheet.


A chart of the small subpopulations showing overall decline since the late 1990's.  Since 2011 there appears to be a promising increase.

However, because the Gunnison population has increased since the 1990's and makes up the largest share of the total population, the total population has increased since 1996.

Wednesday, November 19, 2014

Threatened and Endangered Species around Albuquerque, New Mexico

Threatened and Endangered Species from Bernalillo County, New Mexico:
Birds
Mexican spotted owl (Strix occidentalis lucida) USFWS T State S The owl inhabits canyon and forest habitats across a range that extends from southern Utah and Colorado, through Arizona, New Mexico, and west Texas, to the mountains of central Mexico. They require mature, old-growth forests of white pine (Pinus strobus), Douglas-fir (Pseudotsuga menziesii), and ponderosa pine (Pinus ponderosa); steep slopes and canyons with rocky cliffs for their habitat.
Southwestern willow flycatcher (Empidonax traillii extimus) USFWS E
State E The southwestern willow flycatcher breeds in relatively dense riparian tree and shrub communities associated with rivers, swamps, and other wetlands including lakes and reservoirs. Historically the southwestern willow flycatcher nested in native vegetation including willows (Salix sp.), seepwillow (Baccharis salicifolia), boxelder (Acer negundo), buttonbush (Cephalanthusoccidentalis), and cottonwood (Populus sp.). Following modern changes to riparian communities, this subspecies still nests in native vegetation, but also uses thickets dominated by non-native tamarisk (Tamarix sp.) and Russian olive (Elaeagnus angustifolia), or in mixed native non-native stands

Yellow-billed Cuckoo (Coccyzuz americanus) USFWS T
State S Status applies only to western population beyond the Pecos River Drainage; breeds in riparian habitat and associated drainages; springs, developed wells, and earthen ponds supporting mesic vegetation; deciduous woodlands with cottonwoods and willows; dense understory foliage is important for nest site selection; nests in willow, mesquite, cottonwood, and hackberry; forages in similar riparian woodlands;

Fishes
Rio Grande Silvery minnow (Hybognathus amarus) USFWS E
State E The Rio Grande silvery minnow extirpated; historically Rio Grande and Pecos River systems and canals; reintroduced in Big Bend area; pools and backwaters of medium to large streams with low or moderate gradient in mud, sand, or gravel bottom; ingests mud and bottom ooze for algae and other organic matter; probably spawns on silt substrates of quiet coves.

Mammals
New Mexico meadow jumping mouse (Zapus hudsonius luteus) USFWS E
State E
The New Mexico meadow jumping mouse (jumping mouse) is endemic to New Mexico, Arizona, and a small area of southern Colorado (Hafner et al. 1981, pp. 501-502; Jones 1999, p. 1). The jumping mouse appears to only utilize two riparian community types: 1) persistent emergent herbaceous wetlands (i.e., beaked sedge and reed canarygrass alliances); and 2) scrub-shrub wetlands (i.e., riparian areas along perennial streams that are composed of willows and alders) (Frey 2005, p. 53).


Other Special-Status Species in Bernalillo County, New Mexico:

Invertebrates
Obsolete Viceroy Butterfly (Limenitis archippus obsoleta)                       USFWS SOC
Slate Millipede (Comanchelus chihuanus)                                               USFWS SOC

Birds
Burrowing owl (Athene cunicularia) USFWS SOC Associated with prairie dog (Cynomys sp.) towns in dry, open, short-grass, treeless plains.

Common black-hawk (Buteogallus anthracinus)
State NM T
Southwestern U.S. is the northern extent of this species’ range. Occurs in New Mexico almost exclusively during the breeding season and in migration. Breeding populations known chiefly from the Gila River Valley in the southwestern portion of the state and from along the Mimbres River and the Rio Hondo watershed. Strongly tied to cottonwood gallery forests. In Texas breeds in or near the Trans-Pecos Region, with breeding documented in particular in the Davis Mountains and possible breeding along the Rio Grande. In New Mexico, uncommon summer resident, generally, restricted to the mountainous riparian habitats of the San Francisco, Gila, and Mimbres river drainages. 

Neotropic Cormorant (Phalacrocorax brasilianus)
State NM T
The Neotropic Cormant reaches its northern distribution in southern New Mexico. It feeds in lakes and wetlands.

Bald eagle (Haliaeetus leucocephalus alascanus)
State NM T
Occurs in New Mexico year-round. Breeding is restricted to a few areas mainly in the northern part of the state along or near lakes. In migration and during winter months the species is found chiefly along or near rivers and streams and in grasslands associated with large prairie dog colonies. Typically perches in trees.

Northern aplomado falcon (Falco femoralis septentrionalis)
USFWS E
State E
Associated with semi-desert grasslands with scattered yuccas, mesquite, and cactus.The species has also been reintroduced on the Armendaris Ranch in Socorro and Sierra Counties and on lands administered by the BLM, White Sands Missile Range, and the SLO beginning in 2006.

Peregrine falcon (Falco peregrinus)
State T
A year-round resident and local breeder throughout NM, nests in tall cliff eyries; also, migrant across state from more northern breeding areas in US and Canada, winters along coast and farther south; occupies wide range of habitats during migration, including urban, concentrations along coast and barrier islands; low-altitude migrant, stopovers at leading landscape edges such as lake shores, coastlines, and barrier islands.

Arctic peregrine falcon (Falco peregrinus tundrius)
State NM T
Winters along coast and farther south; occupies wide range of habitats during migration, including urban, concentrations along coast and barrier islands; low-altitude migrant, stopovers at leading landscape edges such as lake shores, coastlines, and barrier islands.

Southwestern Willow flycatcher (Empidonax trailli extimus)
USFWS E
State NM E
The flycatcher is a summer breeder within its range in the United States. It is gone to wintering areas in Central America by the end of September. For nesting, requires dense riparian habitats (cottonwood/willow and tamarisk vegetation) with microclimatic conditions dictated by the local surroundings

Northern goshawk (Accipiter gentilis)
State NM S
Breeds in coniferous forests; winters in farmlands, woodland edges, and open country. Breeds from Alaska east through Mackenzie and northern Quebec to Newfoundland, and south to New Mexico, Great Lakes, and New England; also southward to northern Appalachians. Winters south to Virginia and Southwest.
Unlikely to occur in project area due to lack of coniferous forest habitat.

Broad-billed hummingbird
State NM T
Reaches extreme northern range in desert canyons of southern New Mexico with dense mesquite thickets.
Unlikely to occur due to lack of canyon habitat.

White-eared hummingbird (Hylocharis leucotis)
State NM T
Irregular summer visitor to extreme southeastern Arizona; rare in New Mexico and Texas. Found in Mountain woodlands.

Brown Pelican (Pelecanus occidentalis)
State NM E
Generally found in warm marine waters, rarely occurring inland.  Only individuals seen in New Mexico, near water. May be storm-driven birds that moved inland during duress.

Baird's sparrow (Ammodramus bairdii)
State NM T
A winter resident in New Mexico and Texas. Generally prefers dense, extensive grasslands with few shrubs. Avoids heavily grazed areas.

Bell’s Vireo
State NM T
A small insectivorus bird, prefers dense vegetation of scrubby woodlands, old fields, or mesquite brushlands.

Gray Vireo (Vireo vicinio)
State NM T
Species strongly associated with piñon-juniper and scrub oak habitats. Distributed mainly across the western two-thirds of the state. Prefers gently sloped canyons, rock outcrops, ridge tops, and moderate scrub cover. 

Mammals

Spotted Bat (Euderma maculatum)
State T
Found in open habitats, Ponderosa Pine forests, and marshlands. Suitable roosting sites limits distribution to areas within flying distance of cliffs and stony outcrops. (Adams, 2003)

Pale Townsend’s Big-eared Bat (Corynorhinus townsendii)
State S
Habitat includes montane forests and arid habitats with limited desert scrub vegetation.  Roosting sites include caves, cliffs, and rock ledges but have been found in abandoned mines and other man-made structures. (Adams, 2003)

E = Endangered. Any species considered by the USFWS as being in danger of extinction throughout all or a significant portion of its range. The ESA specifically prohibits the take of a species listed as endangered. Take is defined by the ESA as to harass, harm, pursue, hunt, shoot, wound, kill, trap, capture, or collect, or to engage in any such conduct.
T = Threatened. Any species that is likely to become an endangered species within the foreseeable future throughout all or a significant portion of its range. The ESA specifically prohibits the take (see definition above) of a species listed as threatened.