Showing posts with label riparian. Show all posts

Wednesday, July 24, 2024

Cutting Trees for Water: Are Thinned Forests Wetter or Drier?

Forest thinning can be controversial.  Concerned citizens want to know when logging counts as restoration;  can thinning a forest have beneficial ecological effects beyond reducing the risk of stand-replacing wildfires?  Will cutting trees increase soil moisture because there are less "straws sucking up water", or does it decrease soil moisture due to increased windspeed and more sunlight drying out the forest understory?

April 2017 - views of Rogers Lake, AZ overlooking untreated (left) and treated (right) areas.  Photos by Conor Flynn.  Click this link to play with the slider.  


Whether thinned forests are drier or wetter is complicated.  The excellent paper "Adapting western North American forests to climate change and wildfires: 10 common questions" by Prichard et al provides a good introduction to this question:


"Decreasing canopy bulk density can change site climatic conditions (Agee and Skinner 2005). Wildfire ignition potential is largely driven by fuel moisture, which can decrease on drier sites when canopy bulk density is reduced through commercial thinning (e.g., Reinhardt et al. 2006). Reduced canopy bulk density can lead to increased surface wind speed and fuel heating, which allows for increased rates of fire spread in thinned forests (Pimont et al. 2009, Parsons et al. 2018). Other studies show no effect of thinning on surface fuel moisture (Bigelow and North 2012, Estes et al. 2012), suggesting that thinning effects on surface winds and fuel moisture are complex, site specific, and likely vary across ecoregions and seasons."

Anecdotally, some people have noticed springs beginning to flow again after thinning and prescribed fire in AZ.  My research in NM pinyon noted increased soil moisture at thinned sites (unpublished data), however this could be due to the specifics of how thinning was accomplished at those sites.  Thinned slash was chipped and the chips were left on-site without follow-up prescribed fire.

In addition to water quantity, water quality should also be considered.  Prichard et al point out that "Treatments in watersheds that are distant from the WUI and protect municipal and agricultural water supplies are critical to minimizing high-severity fire impacts that can jeopardize clean water delivery (Bladon 2018, Hallema et al. 2018). For example, post-fire erosion and debris flows may cause more detrimental and longer-term impacts to watersheds than the wildfires themselves (Jones et al. 2018, Kolden and Henson 2019)."  However, even carefully managed thinning and prescribed fire can generate excess erosion from new roads, decreased large woody debris, and increased mobility of light charred wood.  Charcoal washing into local lakes can cause fish kills, even when not generated by catastrophic wildfire.  Creating erosion-control structures as part of forest thinning work could help to mitigate these risks.  

Further research is needed to ensure that large thinning projects adequately account for water cycle restoration in addition to natural stand density and fire interval restoration.  

Saturday, July 17, 2021

Manufactured- versus Local-Material Restoration


This is not restoration.

"Erosion control" plastic mesh has been washed downstream and wrapped around a sapling.


This is restoration:


Carefully-laid rock armors the entrance to a dry pool.  Balanced stones mark the location of human intention.

Wednesday, March 04, 2015

25 Years Without Cows: Hart Mountain National Antelope Refuge

From an article about a recent publication documenting changes on the Refuge:

"By comparing the new photos with the historical ones, the researchers determined that following 23 years of passive recovery after cattle were excluded from the Hart Mountain National Antelope Refuge, stream channels narrowed, woody vegetarian increased, and there was a noticeable reduction in eroding stream banks. Nearly all sites displayed a decrease in bare soil, resulting in an overall 90% increase in plant cover, mainly thanks to grasses, sedges, forbs, and willow. Willow and rush cover increased fourfold. "

The conclusion is clear: “Simply removing cattle from areas may be all that is required to restore many degraded riparian areas in the American West.”

Wednesday, December 17, 2014

Friday, July 12, 2013

Regolith and Quarternary Sedimentology: questions to infer paleogeomorphology and paleoclimate

This image was taken along Las Huertas creek, near the village of Placitas.  Note the lack of developed soil horizons: the top layers appear to be unconsolidated colluvial debris.   Perhaps the sandstone layers below the Juniper roots are paleo-sand dunes?  What then might the different colors indicate?

This image and the following were taken along La Jencia creek, deeply incised into Pleistecene and Holocene sediments in the San Lorenzo Spring quandrangle west of Socorro, NM.    The layers exposed along the creek channel show darker clay and/or organic-enriched layers that may have formed from swamps and/or backwaters along paleochannels.
Screenshot of the Quandrangle geological map, with a red dot on La Jencia creek showing the location of the photos.
This exposure reveals an unconformity in the left-center that may be due to in-filling of a paleo channel?  Does this images show an actual unconformity, with deposition, then erosion, then deposition? Or was there continuous deposition? Why is there banding of light and dark material in such regular layers?  How were these layers laid down?  Does the fact that they were deposited indicate an aggrading landscape, perhaps controlled by climate-influenced sediment supply??

This photos shows a close-up of a tiny (5-foot long) layer of darker clay, clearly deposited in a concavity.  Note the coarser sediment deposited below it and the finer sediment above.  How old are these layers?  How do geologists infer the direction of paleoflow?  Why aren't there fossils?

Surface geology maps of the area offer confusing clues to interpreting these buried layers.  The geological map for the quandrangle to the North of San Lorenzo Springs (the Silver Creek quandrangle) shows paleochannel flows on the surface, as well as relictual dunes from some point in the Quarternary.  Why are the paleochannel flows going every which way?  Was this whole valley a closed basin, and if so, would that explain the aggradation, independent of sediment supply?  Why is this stream downcutting so rapidly today?  What are the implications for the future?

Riparian Restoration Quandary

Plants along rivers face a basic quandary: the closer to the channel they grow, the more water they have.  But, closer to the channel, there is more disturbance from flooding.

So:
  • Is this a healthy/unhealthy stream bank?
  • Is it in need of restoration?

It has:
  • invasive species
  • sparse vegetation
  • obviously eroding banks....

It might be important to ask: What is bankfull here? 

It might also be important to know that this is actually a dry wash, photographed after the first rain in 9 months...it looks grazed, and it is grazed.  By a herd of native Elk, forced out of the uplands by the worst drought in 50 years.

We have to be careful to set our ecological expectations to the history of natural disturbance and the reality of a changing climate.

Friday, July 05, 2013

La Jencia Flash Flood!


Moving at about 5 miles per hour (as judged by floating tumbleweed), the front of the flood (visible here with lots of foamy flotsam) made a roaring sound easily audible at the ranch house.  The brunt of the thunderstorm had passed more than half an hour previous.  Based on cross sections of this reach, the flood was only about 30cm deep, and represented a flow of approximately 50 CFS.  This amount of water may be "bankfull": the bank-side sedges were underwater, the willow got their feet wet, and no major channel geomorphic changes occurred. 

Advancing front of flash flood.

 The next day.


 Flooding along old channel where side canyon empties in.  This channel was abandoned in 2009 when the creek cut through a meander bend.

Saturday, January 05, 2013

NC Stream Watch - New Hope Creek

NC Stream Watch volunteers take monthly samples along an elevational transect of New Hope Creek as it flows from Duke Forest slate belt down through Triassic basic sediments and bottomlands into the northernmost lobe of Jordan Reservoir 

Samples include wetted-width cross-sections to estimate total flow.


Water chemistry including Dissolved Oxygen, Total N and Total P.


Inspection of the macroinvertebrate fauna.  At Old Chapel Hill Rd and New Hope Creek, and at Erwin Road and New Hope Creek, we observed:

Mayfly
Female copepod
Daphnia
Snow Leopard leach
Midgefly
Oligochete
Dragonfly larva
& Asiatic Clam

Saturday, December 01, 2012

Stream Restoration with NCSU

Along Dry Gulch in Carrboro, North Carolina:


Karen Mendenhall (NCSU extension specialist) and city of Carrboro Environmental Planner, Randy Dodd led the riparian planting.  Rock structures had already been installed:


Detail of restoration plunge-pool rock structures.  Not visible is the substrate, an innovative mix of sand and woodchips.

Juncus ephesus was planted below bankfull - hopefully it won't wash out in the big storms of winter!


Species Planted:

Woody:
Betual nigra (Black or River Birch)
Alnus serrulata (tag alder)
Rhodendron austrinum (Florida Azalea)
Hamamelis sp., probably virginiana (Witch Hazel)
Quercus michauxii (Swamp Chestnut)
Platanus occidentalis (American Sycamore)
Salix nigra (Black Willow)
Cornus amomum (Silky Dogwood)
Viburnum sp (Viburnum)

Grasses:

Juncus ephesus (Soft Rush)
Chasmanthium latifolium (River Oats)

Wednesday, February 15, 2012

Beaver vs. Climate Change

A new report all about beaver by my friend and chief Forest Ecologist at Wild Earth Guardians, Bryan Bird. The report, Beaver and Climate Change Adaptation in North America (pdf) contains a comprehensive review of beaver ecosystem engineering and derived ecosystem services.

Beaver occur throughout most of North America:

And they can help engineer the environment in ways that could benefit us selfish humans. I can't resist a before-and-after.

BEFORE

AFTER

Thursday, February 04, 2010

Environmental Degradation in Haiti

Google maps has high-quality satellite imagery of Haiti, and reading remote-sensing images is a big part of my job as an ecologist so I decided to take a brief fly-over to see what it looks like. What immediately called out to me was the widespread and obvious degradation of the rivers and streams; the images of Haiti are consistent with a highly disturbed landscape. Most unconfined rivers in Haiti appear braided, meandering over large areas of bare ground.

These rivers are rapidly aggrading (depositing sediment), most likely due to excess sediment from erosion in the uplands. Of course, natural disturbances such as hurricanes, forest fires, and perhaps even earthquakes, could cause similar river channel adjustments. Braided channels may be a natural response to naturally high-erosional areas. Here is such a stream in Southern California:

If Haiti had a Californian/Mediterranean climate instead of a Carribean climate, these levels of disturbance could be explained naturally. Instead, these high-disturbance, silt-choked rivers and streams are likely better explained by human overuse and consequent environmental degradation: "Haiti...was largely self-sufficient in grain 40 years ago. In the years since, though, it has lost nearly all its forests and much of its topsoil, forcing the country to import more than half of its grain." Brown, Lester R. "Could food shortages bring down civilization?" Scientific American. May 2009. p. 50


Closeup view of wide, unvegetated floodplain in Haiti:

Of course, Haiti is not the only place with altered erosion visible from space. In fact, the images above are becoming the norm across much of the world. Even richer countries have impacted rivers, but some, such as Costa Rica, also have many rivers that are allowed to remain in their unimpacted, natural state. This is what tropical rivers should look like when they have a natural disturbance regime:

Wednesday, February 03, 2010

Springerville, AZ Riparian Restoration Project

Natural Channel Design, inc, has finished their riparian restoration project and evaluation on a stretch of the Little Colorado River near Springerville, AZ.

The site can be visited on a constructed trail: "The trail provides a public walkway along the Little Colorado River from Hwy 260 to Airport Road in Springerville, with a total distance of approximately 4,300 feet."

Friday, November 06, 2009

USGS concludes 2006 was 1,000-year flood near Tucson


Floods are described in terms of their recurrence interval. A 10-year flood has a 1 in 10 chance of occuring each year. Many engineers and flood planners work with 100-year floods, since this is approximately the length of accurate and reliable observations in the West. However, much larger events can, and do, occur.

After studying the aftermath of the floods that wiped out Sabino Canyon in Tucson in 2006, the USGS has concluded that the event was virtually unprecedented. By dating geological deposits, they estimated that the floods that swept down most of the West-facing canyons in the Santa Catalina Mountains were probably on the order of a 1,000 year flood.

However, with climate change and associated land cover changes on the mountains, that interval may no longer hold. Pearthree, section chief of AZGS Environmental Geology, warns, “increasing fire frequency on the steep slopes of the Santa Catalina Mountains due to invasive species like bufflegrass may result in greater runoff, and possibly increased debris flow frequency, in the coming decades.”

Details, including an map.

Other recent flash floods.

Saturday, September 26, 2009

Calibrating Bank Full Measurements Using Regional Curves and USGS Stream Guage Data

Bankfull is important to fluvial hydrogeomorphology (HGM) because it often determines the shape of the channel by moving and depositing sediment. Bankfull (BF) is defined as the high water level that recurs every 1 - 2 years, but measuring it in the field involves using multiple indicators in a 'preponderance of evidence' detective-style approach.

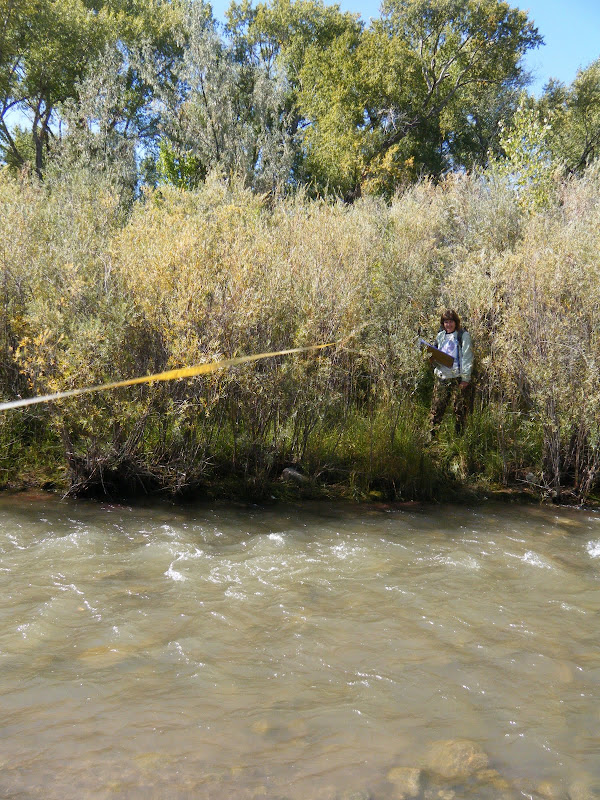
Most plants that cannot tolerate saturated soil conditions for days at a time, like Alders, will not grow below BF, while willows and cottonwood can. Also, the top of point or side bars can indicate the height of BF, but on the Rio Embudo, near Dixon NM, BF indicators were contradictory and hard to find. Is BF just a few centimeters above the base-flow water, or are all the willow below BF?
From Rio Embudo at Dixon, NM Hydrology Analysis
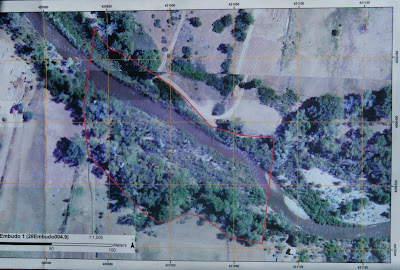
A number of bars and scour features at different heights further compounded the mystery. It was time to seek out other clues. One source of potential indicators was our aerial imagery, which was taken during Spring runoff, 2008:
From Rio Embudo at Dixon, NM Hydrology Analysis
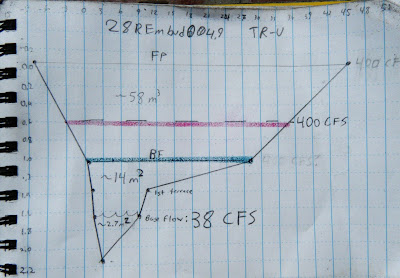
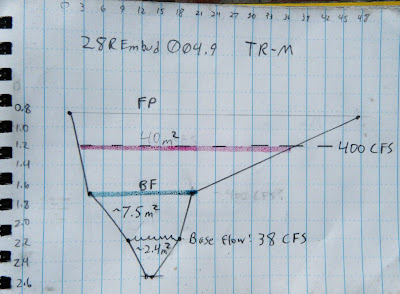
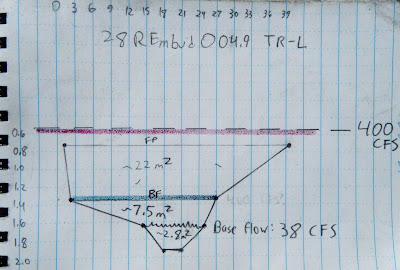
The point bars at bottom right are bisected by a side channel that is several feet above the base level today. That means BF must be at least that high, and would probably inundate most of the willows. Corroborating this, the landowner reports that the willows are indeed flooded almost every year. But exactly how high is BF? To gather more data, we surveyed three channel cross sections, or transects (TR), noting the heights of the major terraces.

TR-Upper
From Rio Embudo at Dixon, NM Hydrology Analysis


TR-Middle
From Rio Embudo at Dixon, NM Hydrology Analysis

Tr-Lower
From Rio Embudo at Dixon, NM Hydrology Analysis

On each of these cross sections we marked where the current base flow water level is, where we think BF is, and where we think Flood Prone (FP) might be. To check these guesses, we correlated those heights with flow data from a USGS gauge just downstream:
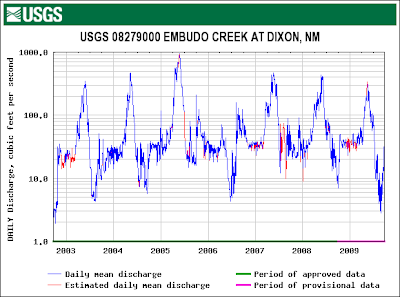
From Rio Embudo at Dixon, NM Hydrology Analysis
From this graph we could see that the high water level with recurrence every 1 -2 years is about 400 cubic feet per second (CFS). We could also see that the current flow was about 38 CFS. If the Rio Embudo is flowing with 38 CFS today, how high would a BF flow of 400 CFS be?

between the flow today and BF flow. To figure that out we might need to correct for any changes in the velocity (feet/second). Manning's Equation:

shows that velocity V is proportional to a constant, u, inversely proportional to a coefficient of friction, n, varies to the 2/3 power of channel cross-sectional area, R, and to the 1/2 power of slope, S. Since neither slope nor the constant would change, we can discount them and focus on n and R; n will likely increase because the willows will act like a series of giant combs, increasing friction, and R will also obviously have to increase. For example, doubling the height of the water would multiply that term by 1.6. Unfortunately, coefficients of friction need to be experimentally determined, so we can only guess at n. To make things easier, I decided friction would also increase by a factor of 1.6, to exactly cancel out R. In other words, I don't think the velocity would change by much.

So it is a simple matter of geometry to calculate the cross-sectional area that would correspond to 400 CFS on our cross sections (red lines on the cross-sections, above). Without exception, this height is higher than our field-determined BF (green lines on the cross-sections, above) and, at least for TR-L, even higher than our FP height.

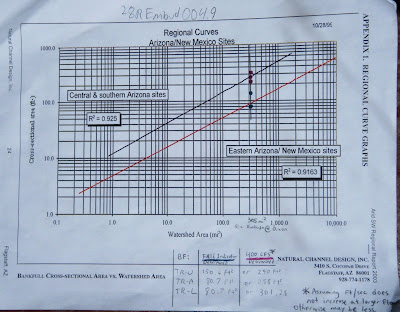
But is this right? Are we getting closer to the truth? To check, we can calibrate our answers for the Rio Embudo against data published by Natural Channel Design on a large number of other Southwestern rivers:
From Rio Embudo at Dixon, NM Hydrology Analysis
I plotted both our field-determined BF cross-sectional area (green points) and the USGS-determined BF cross-sectional area (red points) on the regional curve above. The green points seem to fall on the line for New Mexico, while the red points fall on the Arizona line, corroborating our field measurements and casting doubt on the USGS. However, the watershed above Dixon is very impermeable and could behave more like AZ than NM. I think the true value is probably somewhere in-between the field and USGS values.

This line is probably as close as any to Bankfull:
From Rio Embudo at Dixon, NM Hydrology Analysis

Tuesday, May 19, 2009

Big Tesuque Creek Hike -- Spring Wildflowers!


As one of the Southernmost perennial streams in the Sangre de Christo Range, Big Tesuque Creek, just minutes outside Santa Fe, is a hotspot of biodiversity and a popular hike/bike/equestrian trail. We visited the area a week ago, on the 12th, but came back again this week because we ran out of daylight last time. On a 3.5 mile hike along the Rosgen Class "B" (controlled by colluvial processes) we crossed the creek almost a dozen times and identified more than 40 species. There are several we could not identify, and photos of these are included first. Click on the images to view the full size.


From Big Tesuque Creek Hike -- Spring Wildflowers!


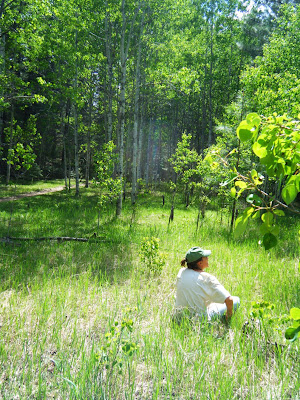
Enjoying the meadow at the upper trail junction. Since there was not much more than a couple violets, Thermopsis, Dandylions, and Mertensia (Chiming Bells), we decided to head down.

From Big Tesuque Creek Hike -- Spring Wildflowers!

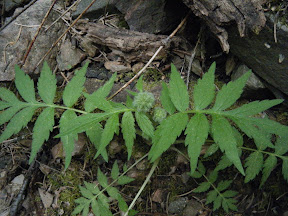
Hydrophyllum.

From Big Tesuque Creek Hike -- Spring Wildflowers!

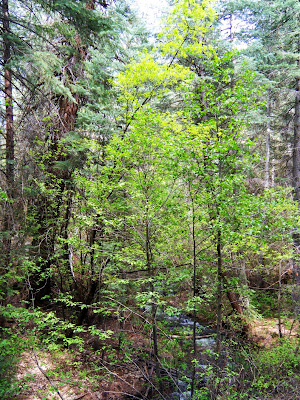
Habitat, showing mid canopy of Alder under Douglas Fir overstory.

From Big Tesuque Creek Hike -- Spring Wildflowers!
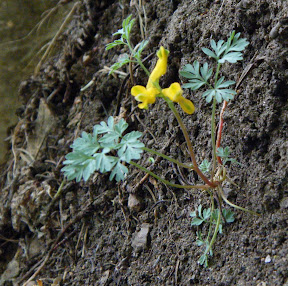
Corydalis.

From Big Tesuque Creek Hike -- Spring Wildflowers!
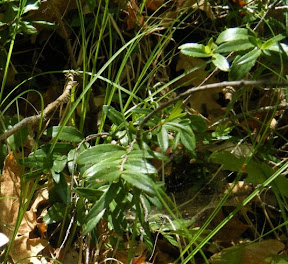
Mountain lover.


Species List

Ponderosa upland -- alder and box elder are prominent, Douglas Fir more so further up the canyon. We counted more than 40 species in flower (designated by an *)

*Tragopogon pratensis - Yellow Salsify
*Clematis columbiana - Rocky Mountain Clematis
*Lathyrus eucosmus - Wild Sweetpea
*Lupinus caudatus ssp. argophyllus - Spurred Lupine
*Many daisies
*Ash??
*Cherry
*Mertensia lanceolata - Lanceleaf Bluebells (some with white, some with blue flowers)
Heracleum maximum - Cow Parsnip
*Viola canadensis - Canada Violet
*Viola nephrophylla - Kidney-leaved Violet
*Cardamine cordifolia - Bittercress
*Valeriana arizonica
*Verbena spp?
*Androsace septentrionalis - Northern Rock Jasmine
*Aquilegia elegantula - Elegant Columbine
*Sambucus recemosa - Red Elderberry
*Actaea rubra - Baneberry
Cercocarpous montanus - Mountain Mahogany
Potentilla anserina
*Geum macrophyllum - Cut-leaves Avens
Geranium spp.
*Erysimum capitatum - Western Wallflower
*Fragaria vesca ssp. americana - Wild Strawberry
*Moehringia/Stellaria spp?
*Maianthemum racemosum - False Solomon's Seal
*Quercus spp.
*Besseya plantaginea - Kitttentails
Vaccinium myrtillus(?)
*Berberis fenleri - Fendler Barberry or Mahonia
*Acer glabrum - Rocky Mountain Maple
Plantago major - Common Plantain
*Taraxacum officinale - Dandylion
*Trollius laxus (?) Globe flower, Ranunculaceae
*Ranunculus ssp. - Buttercup
*Utah Serviceberry
*Alder
Thalictrum
*Several kinds of carrot
Gallium
*Oregon Grape
*Astragalus
*Penstemon
*Indian Paintbrush
Delphinium spp.
*Thermopsis
Wax currant
Gooseberry
*Antennaria spp.
Equisetum spp.
Box elder

I would write more but I am completely exhausted from hiking and botanizing all day.

Thursday, May 14, 2009

RSRA: San Pedro Creek upstream of SR14 Overpass

San Pedro Creek flows out of the San Pedro Mountains, located between the Ortiz and the Sandia Mountains in New Mexico. It may be impacted by current and historic mining in its headwaters, and is currently heavily grazed in this reach. We did notice many small fish, tadpoles, dragonflies, and mayflies, however.

Water Quality: 2,2 = 2
Hydrogeomorphology: 4,5,3,1,1 = 2.8
Fish / Aquatic Habitat: 3,3,5,4,1,2 = 3
Riparian Vegetation: 4,4,2,2,3,2,1,3 = 2.6
Terrestrial Wildlife Habitat: 4,2,1,2 = 1.75

Overall Average: 2.4

The stream radically changes downstream of the highway overpass, where it is managed as a conservation area and supports a rich growth of willow and cottonwood. It goes from a braided channel upstream to a deepened and narrowed channel with plenty of over and underbank cover. It is likely that the grazing regime in our study reach is not condusive to the establishment and growth of woody vegetation.
Saturday, May 02, 2009

Example RSRA's from the Verde Valley, AZ

Examples RSRA's:
(Indicator scores are 1 - 5; 5 is highest)

--------------
Lower Camp Verde SRP

Water Quality
1.Algal Growth: 1
2.Channel Shading, Solar Exposure: 2

= 1.5

Hydrogeomorphology (Stream Form)
3.Floodplain Connection and Inundation: 1
4.Vertical Bank Stability: 4
5.Hydraulic Habitat Diversity:5
6.Riparian Area Soil Integrity: 5
7.Beaver Activity: 4

= 3.8

Fish/Aquatic Habitat
8.Riffle-Pool Distribution: 2
9.Underbank Cover: 2
10.Cobble Embeddedness: 2
11.Aquatic Macro-invertebrate Diversity: 5
12.Large Woody Debris: 2
13.Overbank Cover and Terrestrial Invertebrate Habitat: 5

= 3

Riparian Vegetation
14. Lower Riparian Zone Plant Community Structure and Cover: 3
15. Upper Riparian Zone Plant Community Structure and Cover: 3
16. Shrub Demography and Recruitment: 3
17. Tree Demography and Recruitment: 4
18. Non-native Herbaceous Plant Species: 2
19. Non-native Woody Plant Species: 4
20. Mammalian Herbivory (Grazing) Impacts on Ground Cover: 5
21. Mammalian Herbivory (Browsing) Impacts on Shrubs and Small Trees: 1

= 3.125

Terrestrial Wildlife Habitat
22. Shrub Patch Density: 3
23. Mid-Canopy Patch Density: 4
24. Upper Canopy Patch Density: 3
25. Fluvial Habitat Diversity: 4

=3.5

Overall Average: 3.0
---------

Agua Fria River Below Horseshoe Ranch
Water Quality: 2, 2 = 2
Hydrogeomorphology: 1,4,5,4,1 = 3
Fish/Aquatic Habitat: 3,2,3,5,2,4 = 3.17
Riparian Vegetation: 2,3,3,3,1,5,5,5 = 3.375
Terrestrial Wildlife Habitat: 2,4,2,3 = 2.75

Overall Average: 2.8

------------
Lower Clear Creek

Water Quality: 1,2 = 1.5
Hydrogeomorphology: 1,4,5,5,4 = 3.8
Fish/Aquatic Habitat: 2,2,2,5,2,5 = 3
Riparian Vegetation: 3,3,3,4,2,4,5,1 = 3.1
Terrestrial Wildlife Habitat: 3,4,3,5 = 3.75

Overall Average: 3.0