All I know is this:
BEFORE

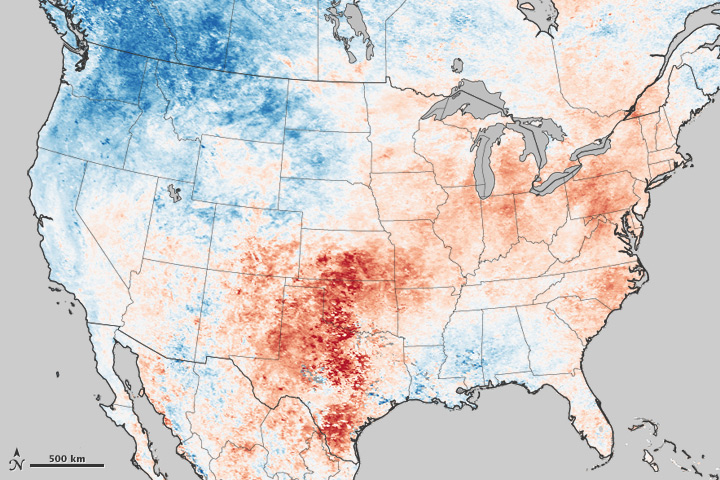
AFTER

From National Geographic


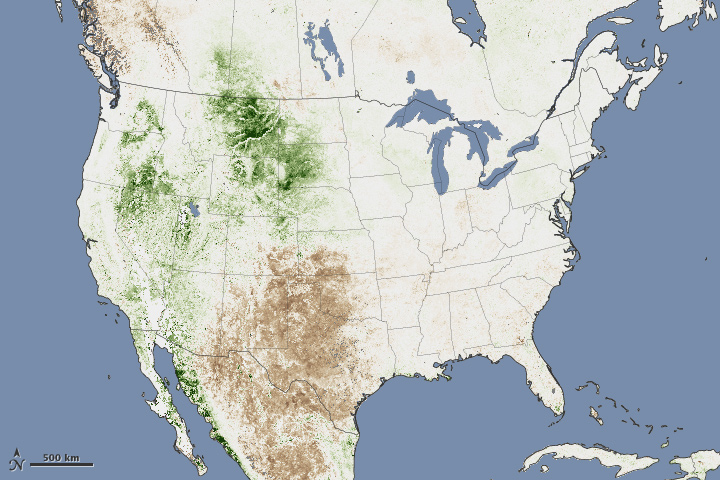
 Earth Observatory.
 Earth Observatory: Heat Wave July 20-27 2011.
 Normal July pattern, which has been amplified by strong ridge, the opposite of the winter time "Aleutian Low" NWS.


 Fig. 1. A demonstration of how carbon flux indices [GSNF, growing season net flux; DSNF, dormant season net flux; AMP, amplitude (|DSNF – GSNF|); NCF, net carbon flux (GSNF + DSNF)] are calculated. Any month for which the net carbon flux is negative is included in the GSNF (open vertical bars). Any month for which the net carbon flux is positive is included in the DSNF (filled vertical bars). Mean 2000–2008 fluxes shown for boreal North America (a) southern Africa (b) and tropical Asia (c).
 Fig. 2. Comparison of decadal mean net carbon flux for individual land regions. Black cross symbols (X) denote the mean of 13 TransCom 3 models, open circle symbols (O) denote mean of the three S07 TransCom 3 models, individual model estimates within the S07 average are denoted by a filled square, circle and triangle. Vertical error bars represent the total 1σ flux uncertainty (quadrature sum of model spread and the root mean square of individual model posterior uncertainty) associated with the mean of the 13 TransCom 3 models. (c) 2000–2008 mean net carbon flux.


 type weather text here
 from: http://nsidc.org/sotc/sea_ice.html
 Image from Earth Observatory: "NASA scientists have found that cirrus clouds, formed by contrails from aircraft engine exhaust, are capable of increasing average surface temperatures enough to account for a warming trend in the United States that occurred between 1975 and 1994."


 source: http://cliffmass.blogspot.com/2011/03/latest-on-japanese-radiation.html
 I've started using a cool Matlab program that generates a 4-dimensional power spectra for any time series. A normal power spectra is averaged over an entire dataset, but this technique, called Wavelet Coherence Analysis using a sliding "window" to examine power spectra continuously over the entire series. Of course, for longer and longer wavelengths, the sliding window necessarily becomes larger and larger, until wavelengths can no longer be measured on the data. The dark black hemicurve on this diagram shows that limit, and the data greyed out beyond that line is edge-affected power spectra.
  Prikryl et al 2009: Solar magnetic sector boundary passage (SBP) and vorticity area index (VAI), by weather reconstruction ERA-40 dataset back to 1963-2002, confirmed the "Wilcox effect". The interplanetary magnetic field and associated "space weather" directly effect Earth's weather.
 The conclusion? Leif 2007 finds no long-term trend in solar irradience from at least 1600. through the present.


