Showing posts with label satellite. Show all posts

Tuesday, July 30, 2024

How to Use Satellites to Find Growing Plants: A Practical and Theoretical Guide


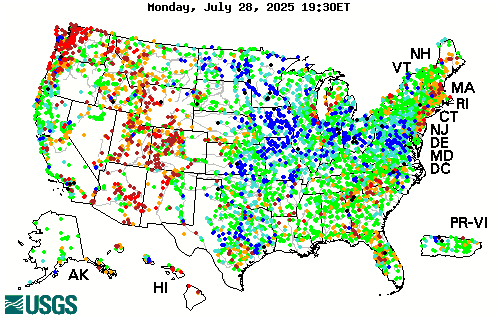
USGS Maximum consecutive dry days, July 2024


Introduction

Knowing where and when plants are green and growing would help botanists and ecologists plan field work and help managers make real-time land management decisions.  There are many potential sources of geospatial data available but it is difficult to know which sources are most useful.

Over the past year I evaluated the accuracy and interpretability of dozens of indicators that could be used to assess current growing conditions.  These websites, maps, and data layers are mainly provided by US Government agencies to help managers respond to natural resource concerns such as rangeland management and drought impacts.

In my opinion, none of the available resources is a perfect fit to find growing plants.  However, understanding how plant growth is related to biophysical constraints can help identify the best available resources.


Plant Growth Theory

Plant growth (Net Primary Productivity, NPP), is proportional to total soil moisture (SM) and Growing Degree Days (GDD) of accumulated Temperature (T) since the start of that plant's growing season.  Soil moisture depends upon accumulated (total and frequency of ) precipitation (P) minus evapotranspiration (ET).  

 NPP = Sum (SM*T)

 SM = Sum (P-ET)

[In the above equations, "equals" is used to mean proportional, or depends upon. ]

The ideal resource for plant growth would be a direct measurement of NPP.  A second option would be measurement of soil moisture and temperature, with a way of combining them to estimate NPP.  A third option would be measurement of precipitation, which could be used to estimate SM. All of these variables can be measured via satellite, but delays make them difficult to use in real time.  Also, there are important details in how they are measured and modelled that make interpretation difficult.  


Details

Plant Growth: satellites can measure NPP via NDVI (Normalized Difference Vegetation Index), but available sources are delayed (DroughtView), low-resolution (GIMMS), weighted toward trees, and contain artefacts early in the growing season.  Existing models of NPP are not well-calibrated (VegDRI), or delayed and not mapped (RAP).

Soil Moisture: satellites can measure SM, but satellite data (SMAP) is not consistently available, may be inaccurate, and only provides a snapshot, not the sum.  Models of SM are not well-calibrated (NASA LIS).

Temperature: sensor networks can measure T and calculate Growing Degree Days (NPN) but aspect and micro variation are often more important than county-level temperatures.  This is helpful early in the growing season.  

Precipitation: radar and rain gauge networks can measure P and are timely and accurate.  Maps of accumulated P are available from NOAA and number of days with/without rain in the last month from USGS.  However, because P is not a direct measure of NPP, this can only be a general guide to plant growth.  


Conclusions

P - Best. Note that both total and frequency matter.

SM - not available.

T - GDD is helpful in Spring phenology, but don't matter later in the season.

NPP - difficult to use.  Good for viewing thinning and forest fires, not very helpful for spotting wildflower growth or distinguishing between grass and tree green-up.  


NOAA precipitation accumulation as percent of normal for July, 2024

Practical How-To

I recommend using a balance-of-evidence approach that combines the two best sources of precipitation information, NOAA for total accumulation, and USGS for frequency.  If both sources show good precipitation during the recent growing season, there is a good chance that plants are growing well in response to abundant and regular moisture. 

NOAA's National Water Prediction Service provides accumulated precipitation over any time period from 2005-present with less than 24 hour delay.  Their web viewer is currently the only way I know to view this data because I don't have the programming skills to use their API.  

Scroll down to Precipitation Estimate, where it is possible to set the time period of interest and map Precipitation in terms of Observed (totals), Normal (average), Departure from Normal (inches more/less than normal), and Percent of Normal.  The map is sometimes glitchy depending on connection speed.  More details about how precipitation is calculated are available in the help guide.  Note that this map is usually up to date for the previous "water day" ending in the early morning (so for AZ, selecting "Today" shows precipitation that occurred yesterday through 7 am today).

USGS's Drought Monitor provides access to several precipitation metrics, with a 48 hour delay. To assess precipitation frequency/regularity, I use Maximum Consecutive Dry Days (Past 30 days) and Days Since Precipitation.  They also offer total accumulated precipitation over the last 7 and 30 days (again, with a 2 day delay).  Their web-viewer is clunky and hard to use, but it is easily available.  Double click on the Dataset of interest in the left pane and resize the resulting window to view the area of interest.  The layers have no opacity, so to view the underlying map they have to be checked on/off in the Layers pane.  

They also make their data available as WMS that can be added to any ArcGIS desktop or online map.  The opacity can be adjusted on the Group layer that is created after the data is mapped.  However, the time-enabled settings can be difficult to use, and I haven't figured out how to show the data time period.  The web viewer is easier to change the time period and to see the data date range.

Note that USGS Drought Monitor also provides VegDRI and QuickDRI, two models that claim to incorporate all of the biophysical variables listed above (and then some!) to model NDVI difference from average.  These models are extremely complex, but they don't seem well-calibrated to Arizona because I have not found them to be very accurate or helpful.  

Thursday, April 18, 2024

Spring Update: NDVI Differences

Last September, I wrote about Finding the Greenest Place in AZ.  This Spring, we have continued to compare and evaluate the different NDVI difference mapping applications and compare them to the actual growth of wildflowers and grasses we see when we go out hiking.  

Methods

I conduct pre-field research to identify predicted greenness/moisture from UA's Droughtview, USGS VegDRI, and NWS Accumulated Precipitation.  I take a screenshot of each product and assign the proposed site a scale from 1 (driest) to 10 (greenest).  We then visit the area and evaluate the plant production, recording example photos of overall landscape greenness, as well as assigning a score.  The data are organized in a OneNote table.  I then compare the numerical scores in an excel table, adding up the differences between each model and the observations.  


Results

So far, the UA model seems to slightly overestimate greenness, the USGS model greatly underestimates greenness, and the NWS precipitation record comes out closest to observation.

For the UA model, I think it might be helpful to have a difference from maximum, instead of the difference from period. The latter overestimates early spring greenness when the denominator NDVI is very small, so any amount of NDVI in the numerator saturates the index.  Using the maximum NDVI for that pixel could help with this phenology issue.  Plus, % of maximum NDVI may be more intuitive than “difference from average”.

The USGS VegDRI index consistently estimates pre-drought to severe drought in areas that have above average precipitation this water year and have an NDVI above average.  This leads me to think that VegDRI 7-Day eVIIRS is either not well calibrated to the desert southwest, or perhaps that it is better used as a predictive index – perhaps these areas are drying out even though they currently appear green?  However, SWCC does not show significant vegetation drying yet in the areas I assessed.  


Examples

Wingfield Mesa:  UA Droughtview shows this area at maximum NDVI (for this time of year)(=10/10), USGS showed it as pre-drought to moderate drought (4/10) , and NWS shows 125-200% of normal year to date precipitation (9/10).  It is quite green, but it is still early in the growing season and the mesquite have not leafed out yet.  We rated it 6 out of 10.  


Dugas Rd:  UA shows above average (8/10), while USGS showed Moderate drought (3.5/10) and NWS showed slightly below average precipitation (75-90%) (3.5/10).  It is quite green right now, but again not quite at maximum greenness production.  We rated it 8 out of 10.   

Wednesday, October 15, 2014

Suburban Development Transect: Biodiverse Desert to Trash-filled Parking Lot

2000

2003

2008

2011
A transect walking a few miles from the indisturbed desert through new housing developments into the city looks like time played in fast-motion.  The ecologist's glasses allow us to see the moving picture of life rather than limiting our vision to the usual single frame.  By substituting space-for-time, we can put on time-travel goggles.  What do we see?

Normally we visit a site for a day, maybe once a year for intensive longitudinal studies, maybe never again.  With this transect we could see the changes in species composition from unique, biodiverse desert with its gnarled shrubs to fresh asphalt streets, planted landscaping and lawns, and a monoculture of weeds in the bladed 'empty patches' between houses and in right-of-ways.  The stream channels were all filled in and replaced with impoundments or concrete-lined ditches.

Eventually we ended up in the back lot behind a storage unit complex.  The slight depression there caught water and supported some of the tallest native flowering trees we'd seen.  The lot was also used, apparently, as a dumping ground and was filled with all kinds of trash.

Later that night, back in my home neighborhood, I saw dual-images of what the land looked like before and after development.  I saw the rocky ground thick with idiosyncratic cacti and weird four O'clock flowers.  And I saw wide asphalt streets, joggers, tall pine trees, oleander, and grass lawns.  It is so difficult to see the past, I felt that my dual-vision was a kind of X-ray superpower, a new found ability to see through reality to what might have been.  Reality has a way of erasing the possibility that things could have turned out differently.

A nice walk in the wilderness can sometimes substitute space for space, so that you can see your neighborhood space as the absence of native wildlife instead of the presence of cars, roads, and lawns.  I suppose some people see nature as empty, and even I see it this way sometimes too: some areas are devoid of active communal life.  For example, on this particular transect we saw no rabbits, no ground squirrels, and no other mammals in the wild.  I don't think we saw a lizard until we got to the rock walls of suburbia.  But I was amazed at the botanical emptiness of our developed landscapes: out of the more than 70 native species of wildflowers and Chihuahan desert shrubs, I saw less than 5 after we crossed the first freshly paved asphalt road.

Of course, there are a diverse mix of landscaping plants, many of them native somewhere, if not in the Chihuahan desert.  Interestingly, the mexican palo verde seems to have escaped cultivation and is now growing up into the wild watercourses that snake off the mountains.  Few other weeds seem able to invade intact ecosystems, although Russian thistle is omnipresent wherever the ground has been cleared.

I think, though, that if the transect had continued further into the past/future, through abandoned neighborhoods or restored areas, the native wildflowers and shrubs would reappear.  Especially with the rains this monsoon, they seem quite happy where they are, and old pipelines have a nice covering of desert marigold, creosote, and javalena bush.  I don't really feel that the desert is destroyed by development...maybe in the long-term view it just goes away for awhile, or changes shape for a spell.  Until the wave of bulldozers breaks and subsides, the desert remains as potential...

Friday, September 05, 2014

Review of Soil Moisture Measurement Techniques


Advances in efficient, broad measurement of soil moisture are needed to understand plant stress response to drought.  Crop growth and phenology can be predicted (link) with accurate modeling of soil-plant-atmosphere interactions.  These dynamics are also crucial for advances in meteorology, since most rain that falls in the U.S. is recycled rain that has already fallen and evaporated at least once before, but often several times.  Accurate prediction of rainfall will continue to elude meteorologists until soil moisture can be measured and predicted.

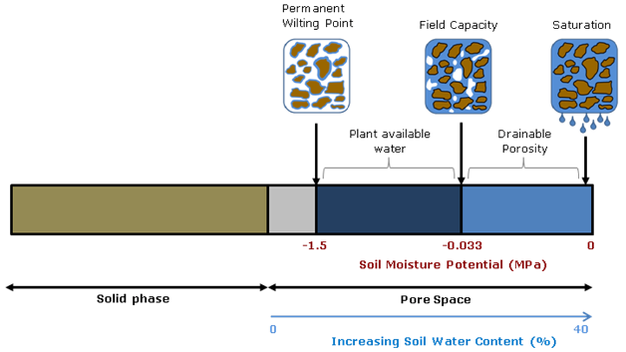
Soil moisture is critical for advancing plant and atmospheric sciences,  but the fact that different measurement techniques yield different values points to the fact that soil moisture is essentially an abstract idea.  While the water content of soil would seem to be straightforward, whether you calculate volumetric or gravimetric water content, and whether you consider chemically- and physically-immobilized water or only plant-available water (field capacity minus permanent wilting point) matters a great deal.


Diagram source.

Spatial and temporal scale also matters.  Do you want an instantaneous point measurement, or a daily weekly average for an entire county’s drought status?  Picking the right tool for the job means understanding the streghths and weaknesses of the entire gamut of technologies capable of reporting soil moisture.  This article will start with traditional in situ point measurement techniques and continue to review broad-scale soil moisture modeling and remote-sensing efforts.


from Shuttleworth 2013

Small-scale measurement can be accomplished using point-sampling with portable soil moisture probes, such as TDR and traditional (active) neutron probes.  Of course, any discussion of soil moisture measurement techniques would be incomplete without mentioning the gravimetric method, or simply weighing a soil sample wet and then dry.  But as with the other point techniques, this method can only measure hyperlocal conditions and must be replicated and averaged to inform landscape-scale management.

TDR, or time-domain reflectometry, uses the electrical properties of soil and water to calculate volumetric percent soil moisture.  For most soils, excluding those with very high organic matter (OM>10%), the TDR method without calibration provides water content in the range from zero to 50% with accuracy better than 1-2%.  While calibration and new TDR such as TRIME-TDR can improve accuracy by a factor of 10-100, the amount of microscale variability in soil means that these point measurements must be replicated dozens to hundreds of times to build up a picture of average site moisture. Microvariability can be important when precipitation preferentially flow along soil heterogeneities such as roots, textural changes, and bioturbation pathways.    Buried probes that use the TDR techniques, such as the Stevens Hydroprobes I used in my graduate research, are fixed in place and are therefore severely limited by their inability to average site variability.
  
Traditional neutron probes work by bombarding the soil with high-energy neutrons and recording the number of neutrons emitted by the soil.  Hydrogen absorbs neutrons so the amount of H2O can be calculated.  This technique solves many of the problems of TDR, but the sensors are expensive and the measurement still must be repeated several times to measure field soil moisture.  

-

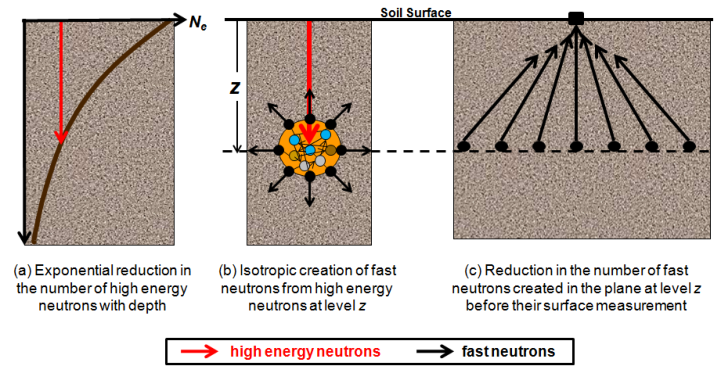
Meso-scale measurement can now be accomplished using the new COSMOS (Cosmic-ray Surface MOisture Sensor) program to measure whole ecosystem moisture.  Neutron moisture probes have been around for decades but COSMOS uses advances in particle-physics technology to increase sensitivity enough to rely solely on the background cosmic radiation as a uniform source of neutrons.  This advance makes possible, for the first time, instantaneous field-scale measurement of soil moisture.


These new sensors were originally deployed in 2010. They have the potential to revolutionize studies of soil moisture because they are the only technique to measure soil moisture at scales between the hyper-local point measurements and the kilometer-swaths of satellites.  They also are the only soil moisture probe that can account for water stores in living tissue.  According to Hydroinnova, one company that makes these $10,000 units, the measured soil footprint is 86% within 350 meters and the effective measuring depth changes with soil moisture, from a maximum of 70 cm in completely dry soil, to a minimum of 12 cm in saturated soil. 


Source.
While these sensors are few in number and relatively widely dispersed, they offer a whole new picture of soil moisture at the landscape level.  They are the only truly effective direct measure of soil moisture at the hectare level, and can be used to better calibrate the informational products discussed below.  However, as with all techniques, COSMOS must also be calibrated to take account of different soil types and changes in vegetation.

-

Large-scale measurement of soil moisture can be accomplished using proxies, satellites, models, or some combination of techniques.

River flow data can reveal how much water is running off or through the soil from watersheds, so using a site like the USGSstreamflow network is a good proxy for large-scale short-term drought and deluge.


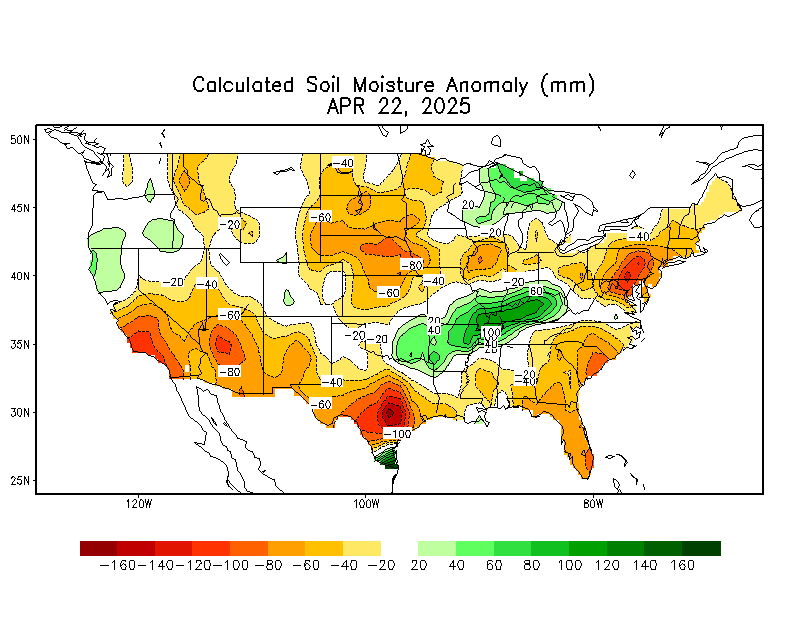
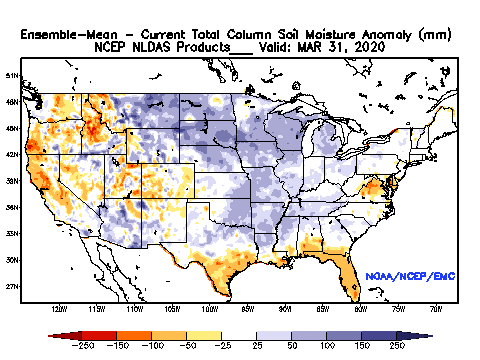
The current best methods for estimating large-scale soil moisture are the Drought.gov model products, which include the Palmer Drought Severity Index, soil moisture index, etc.  The Calculated Soil Moisture Anomaly is calculated based on observed precipitation and temperature.  Soil moisture, evaporation, and runoff for the entire US and globe are then modeled based on observations from a small area of eastern Oklahoma.  While this method is clearly biased, it is the best available.

The National Land Data Acquisition System is developing a more accurate model of soil moisture that incorporates soil textural properties and average percent vegetation (which impacts evapotranspiration).  The precipitation data used in the model is at approximately 25km resolution, interpolated to 13km grid cells:


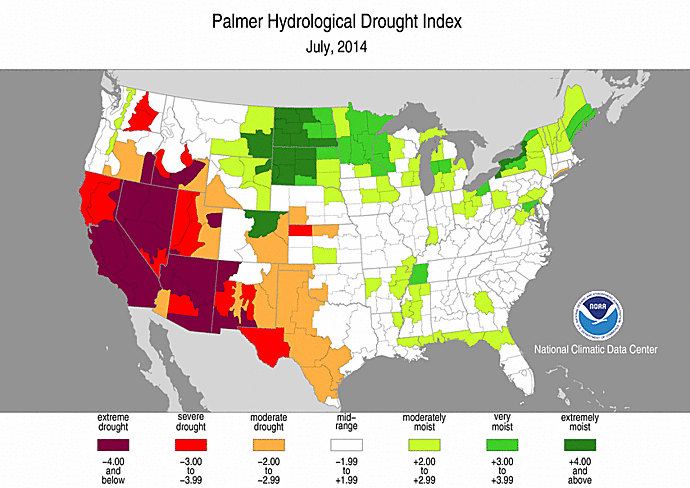
Palmer Drought Indices are similar to soil moisture models in that precipitation, evapotranspiration, and runoff are used to calculate remaining water balance.  There are long-term (Palmer Drought Index (PDI) and Palmer Hydrological Drought Index (PHDI) indices that measure changes in groundwater and reservoir levels, and short-term indices (Palmer Z Index and Crop Moisture Index (CMI)) that affect agriculture during the growing season.


 Interestingly, the US Drought Monitor, which looks essentially like one of the Palmer indices, is subjectively drawn using “a blend of science and subjectivity”.


Sunday, February 03, 2013

February Blocking Pattern

This computer model (GFS) of near-surface temperature (actually, just above the boundary layer) and atmospheric pressure shows an interesting pattern of high and low pressure areas.  A high pressure region over the Azores is predicted to hold steady for the next several weeks, in effect blocking the normal flow of the jet stream and Eastward-migrating low pressure regions.  These lows are forced to travel (clockwise) all the way around the high pressure region.  The consequence appears to be a trough in the jet stream over Eastern  North America, leading to large incursions of Arctic air, and very, very cold temperatures (see graph).

Saturday, March 24, 2012

Summer in Spring 2012

"This March, we started with twelve days of April weather, followed by ten days of June and July weather, with nine days of May weather predicted to round out the month"
image from Dr. Jeff Masters

Thursday, February 10, 2011

Global CO2 plumes


Ever wonder where our oxygen comes from in the winter? When vegetation dies back in the Northern Hemisphere, we have to subsist on old air until the summer. In this image, you can see the plume of carbon dioxide downwind of large human population centers.

http://svs.gsfc.nasa.gov/vis/a000000/a003500/a003562/index.html

Thursday, February 04, 2010

Environmental Degradation in Haiti

Google maps has high-quality satellite imagery of Haiti, and reading remote-sensing images is a big part of my job as an ecologist so I decided to take a brief fly-over to see what it looks like. What immediately called out to me was the widespread and obvious degradation of the rivers and streams; the images of Haiti are consistent with a highly disturbed landscape. Most unconfined rivers in Haiti appear braided, meandering over large areas of bare ground.

These rivers are rapidly aggrading (depositing sediment), most likely due to excess sediment from erosion in the uplands. Of course, natural disturbances such as hurricanes, forest fires, and perhaps even earthquakes, could cause similar river channel adjustments. Braided channels may be a natural response to naturally high-erosional areas. Here is such a stream in Southern California:

If Haiti had a Californian/Mediterranean climate instead of a Carribean climate, these levels of disturbance could be explained naturally. Instead, these high-disturbance, silt-choked rivers and streams are likely better explained by human overuse and consequent environmental degradation: "Haiti...was largely self-sufficient in grain 40 years ago. In the years since, though, it has lost nearly all its forests and much of its topsoil, forcing the country to import more than half of its grain." Brown, Lester R. "Could food shortages bring down civilization?" Scientific American. May 2009. p. 50


Closeup view of wide, unvegetated floodplain in Haiti:

Of course, Haiti is not the only place with altered erosion visible from space. In fact, the images above are becoming the norm across much of the world. Even richer countries have impacted rivers, but some, such as Costa Rica, also have many rivers that are allowed to remain in their unimpacted, natural state. This is what tropical rivers should look like when they have a natural disturbance regime:

Tuesday, January 19, 2010

Global Fire Trends and Consequences

In the modern age, the Anthropocene, global biogeochemical cycles are skewed by the massed action of almost 7 billion human beings. Chief among these forcings is the burning of both fossil and modern biomass. The burning of crops and forest by humans can be viewed on a global scale with imagery from NASA's Earth Observatory. Some of the fires viewed by NASA's satellites are due to natural causes, some are due to human causes, and many are a combination of human land use practices and natural causes.


Fires in the Amazon have increased to 2007. The good news is that since then the fires seem to have decreased, possibly as a result of lowered Soy and Beef prices.

A number of sources have recently discussed melting glaciers in the Himalayas, probably due to a combination of global temperature increase and soot (carbon particulate) from burning.

Africa has some of the most pronounced anthropogenic burning, although it is debatable whether much of the semi-arid regions would burn naturally. Interestingly, the Sahel is also reported to be "greening" since the droughts of the 1970's. I was first alerted to changes taking place in the Sahel by a short article from the University of Arizona School of Natural Resources. Now, I read in The Nation, an article by Mark Hertsgaard about farmers in Burkina Faso who have let trees grow in their fields (because of changes in government regulations that let them own trees on their land) to increase the productivity of their crops. However, after reading this, and other, sources, I'm still having trouble understanding farming practices in the region, specifically in regards to reconciling the massive burning evident from MODIS with the greening described in the articles.

Australia has also recently been afflicted by catastrophic wildfires caused by a combination of extreme drought and heat waves.

Soot is near the upper right corner of this diagram from C.A. Masiello, “New directions in black carbon organic geochemistry,” Marine Chemistry 92, no. 1-4 (December 1, 2004): 201-213.
Ironically, pyrolysis, or the incomplete combustion of biomass to create charcoal or biochar, is now touted as a possible technology to increase crop productivity by simultaneously sequestering carbon. Not as currently practiced, though.