Showing posts with label weather. Show all posts

Tuesday, October 14, 2025

Atmospheric Streams Subsidize Valley Forests

I invented a new term to describe small-scale flows of water in the atmosphere.  Just as atmospheric rivers are large flows that transport tropical moisture thousands of miles to the mid-Latitudes, atmospheric streams share the moisture of the mountains with the valleys.

Example of an atmospheric river: Hurricane Priscilla projected track from October 7, 2025.  The remains of this storm brought copious moisture to the desert Southwest.


I first starting thinking about this when I noticed that the new weather station in the Watson Woods Riparian Preserve was often colder in the mornings than weather stations on the surrounding hills.  

Note the 40 degree temperature swing from cool (30's!) temperatures at night, to warm (80's) temperature during the day.

This is caused by katabatic winds from the mountains:

"On clear nights with calm winds, the ground cools rapidly. Air in contact with the colder ground cools by conducting heat to the ground. When this cooling process occurs along mountain slopes, the cooling air becomes colder and denser than the air away from the slopes, which causes the cold air to sink downslope. The dense cold air flows downslope in streams (called katabatic winds) following the steepest slopes. When the cold air flows into a relatively flat area (a mountain or river valley, for example), the streams of cold air slow down. This causes the valley to fill with cold air, much like streams filling a lake. "(MountWashington.org)

Hubbard Brook Experimental Forest, a good example of cold air drainage.

Atmospheric streams are distinct from the riparian drainages they follow, because air flows differently than water:

"Air flows in much larger volumes relative to the topographic surface. Water, even in hillside gullies, flows in volumes that are small relative to the scale of the landscape, and hence topography is the major control on the flow. Air masses are generally much larger relative to the landscape. This can lead to rather different effects. When a shallow cold air flow is moving slowly or is strongly stratified, it can become trapped by topographic barriers that would not trap water. Conversely, when the cold air flow is rapid or has lower stratification, it can flow over barriers, rather than go around them and so minimize friction.” (Research Meteorology)

Cold air flows are an important part of riparian ecology.  A study at the Coweeta Long Term Ecological Research (LTER) site found that cold air drainage subsidizes valley ecosystem productivity.  The study observed lower temperature air from the mountains cooling riparian forests, which lowered their carbon loss due to plant respiration.  The cool air must be a welcome respite for plants during the heat of summer.

Image from Coweeta LTER site in the South Carolina Appalachian mountains.

Cool mountain air can also be moister than valley air, especially in arid regions like Arizona.  Riparian streams carry water from mountains to valleys, while invisible atmospheric streams carry water in the form of humidity.  The extra boost in humidity only becomes visible (as fog) when the temperature drops below the dew point. The studies I looked at did not measure humidity, but it makes sense that higher elevation forests would have moister air than the hotter valleys.  When they share their air, they share their water.

Atmospheric streams are an important, but often overlooked, part of the global water cycle that carries moisture from the land to the ocean.  The recycling and transport of water from one part of the land to another part is sometimes called the "small water cycle".  We still have much to learn about the way our planet works!

El autobus magico: viaja por el agua

Thursday, March 06, 2025

The DRIP Model: Not Drought nor Deluge

How to find green growing plants in Arizona, a state famous for its long droughts and intermittent, but torrential, rains?  Previously I reviewed the available public models for drought, NDVI, and rainfall, and concluded that rainfall was most useful.  However, the most important factor for plant growth is regular consistent rain.  Not drought, but also not deluge.  I hypothesized that a consistent "drip" of at least 1/4 inch of rain each week would yield the best plant growth, and I created a GIS model to map this.  

Methods
lots more info at the bottom link for PDF: NWPS Products and User Guide

GeoTIFF The new QPE GeoTIFFs generated from the NCEP Stage IV data are multi-band GeoTIFF. The bands they contain are: 
● Band 1 - Observation - Last 24 hours of QPE spanning 12Z to 12Z in inches 
● Band 2 - PRISM normals - PRISM normals in inches (see Appendix A- Normal Precipitation) 
● Band 3 - Departure from normal - The departure from normal in inches 
● Band 4 - Percent of normal - The percent of normal

I only use Band 1, for the previous week, not 24 hours.

I download the data using a Power Automate FTP query for: concat('https://water.noaa.gov/resources/downloads/precip/ ', variables('Date2'),  '/nws_precip_', 'last 7-days_', variables('CurrentDate'), '_conus.tif')

In GIS, I Clip rasters to extent and calculate threshold (0.25") for each week:


Then I use Cell Statistics to add all threshold files for a several month period.

Results
10/13-12/01, each week gets 1 point for rain over 0.25"
Northern CA, and areas NE of AZ received more regular precipitation. This beginning of the water year period is important for early germination of desert winter annuals that can lead to "superbloom" springs.  Because most desert areas in AZ did not get much precipitation, the indications were not good for 2025 spring.

12/8 to 3/5, each week gets 1 point for rain over 0.25"
The highest mountains in UT and CO got regular precipitation, as did northern CA. NM did not continue wetter than AZ.  This winter period is important for desert spring ephemeral flowers.  While some areas of the Mojave did get rain, there was basically no rain in the Sonoran desert during this period. 

Thursday, March 23, 2023

Climate Prediction Skill

The US Climate Prediction Center issues forecasts beyond the normal National Weather Service's 10-14 day window.  They provide weekly and monthly forecasts out to 3 months.  Given the timeframe and the fact that their forecasts cover the entire contintental US, its not surprising that the forecasts are often wrong.  But how wrong?  And is their skill improving over time?

I analyzed their 3 month temperature and precipitation forecast skill using data provided on their "Gridded Seasonal Verifications" webpage.  

Note that skill is measured on a scale from -50 to 100, where -50 would be a forecast that was exactly wrong in every area, 0 would be a prediction that did no better than chance, and 100 is a prediction that was exactly right in every area.  


They provide data starting in 1995.  Since that time in the mid 1990's, linear trendlines show that their forecast skill has slightly improved for both Temperature and Precipitation.  Precipitation skill started out lower, but has almost doubled (from 10 to 20) while Temperature skill started higher but has not increased as much (from 22 to 28).

However, the last 10 years have not been as successful:


Since 2012, neither Precipitation nor Temperature skill have increased.  In fact, mean temperature forecast skill has decreased markedly since 2018.  Before that, Temperature skill had been doing quite well in the period 2014-2018.  It is not clear what changed in 2018.  A similar transition may be happening with Precipitation, where the period 2019-2022 saw consistently good predictions, but since the beginning of 2023 the forecast skill has fallen off a cliff.

With increased use of machine learning, it seems likely that long-term weather forecast skill should increase.  However, complex chaotic weather patterns are most impactful to climate predictions in the 1-3 month time frame, so this area of weather/climate prediction may continue to have lower than hoped for success.  


Wednesday, January 20, 2021

2020 Disasters


https://www.noaa.gov/stories/record-number-of-billion-dollar-disasters-struck-us-in-2020


Wednesday, September 28, 2016

Albuquerque 2016 Monsoon Season

From the ABQ NWS Homepage.
The monsoon began early in Albuquerque this year, with a week of good moisture at the end of June. But then June high pressure returned and most of July was hot and dry.  It wasn't until the beginning of June that the rains reliably returned.  Overall, the monsoon wasn't bad, but the hiccup in the beginning ended up dooming most annual plants.  Only perennials managed to reap the rewards of the late-breaking monsoon moisture.  Now, at the end of September, many monsoonal plants are still trying to finish flowering and set seed.  Many plant species are flowering late and show signs of stunted growth.

Friday, December 18, 2015

2015 New Mexico Weather Recap

The ABQ NWS office has an excellent recap of the state's weather over 2015.  For example, here is their summary of the summer monsoon:

The 2015 monsoon season got off to a quick start with heavy rainfall, floods, flash floods and severe weather in mid and late June, as well as the first two weeks of July.  A relatively quiet period ensued for most of the remainder of July. A resurgence of heavy rain returned from very late July through early August.  An outbreak of severe weather was the dominate weather story in mid August, and to a lesser extent on September 9th and 23rd. 
products issued during monsoon season
By the numbers:  The Albuquerque NWS office issued 53 flash flood warnings between June 15 and September 30. 

The biggest news of the year was probably the good precipitation that finally ended the drought that began in early 2011:

Drought conditions developed across New Mexico in early 2011, with few breaks in the drought through 2012, such that much of the state was gripped in the worst drought episode since the 1950s.  Near normal statewide precipitation in 2013 and 2014 did little to improve the drought.  Much of the precipitation in 2013 and 2014 fell during the monsoon season, rather than the much more needed winter mountain snowpack.
Finally, New Mexico precipitation in 2015 was above normal for much of the year, and the period January through November was the fifth wettest on record since 1895.  As shown in the graph to the right, precipitation in New Mexico was well above average in January, May, July and October, with only two months below average - August and September.  These wetter than normal conditions supported a steady reduction in the intensity and coverage of the short term drought.  Finally, in early December 2015 New Mexico was drought free!  The last time the state was without any drought status was the week of November 23, 2010!
By the numbers:  New Mexico went 263 weeks with a portion of the state in moderate or worse drought!
NM monthly precipitation for 2015
  
 percent of new mexico in drought since 2011
 Source: U.S. Drought Monitor

Wednesday, June 10, 2015

El Nino in the Spring

March, April, May and the first week of June have been quite wet for the East slopes of the Rockies and the Western Great Plains, with large regions receiving more than three or four times normal precipitation.  Meanwhile, the West has continued its drought, with CA looking especially dry.
NM has significant regions above 400% of normal precipitation.  While there is lush growth in some areas, other areas are not appreciably greener than they might otherwise be.  Sometimes this can be attributed phenology (e.g. to summer grasses not responding to early spring rains, or perhaps the exact timing is important for annual germination), but some must also be due to the severe productivity reduction of overgrazed and eroded soils.

El Nino has strengthened in recent months.  An active fall hurricane season supplyied NM with abundant moisture in the fall, In the winter a steady progression of Pacific storms brought an average amount of precipitation.  And since late May we have already experienced large moisture plumes from yet more unusually-strong Eastern Pacific hurricanes,  Andres and now, currently, Blanca.


Thursday, September 25, 2014

Hurricane Odile Rain in New Mexico

Just as September 2013 will be remembered for rain in New Mexico, so will September 2014.  The southern half of the state has been bombarded by a continuation of monsoonal tropical moisture, bolstered by the remnants from Hurricane Odile.

The area around Carlsbad Caverns in particular has had more than 20 inches in the last week, more than any other location in the U.S.  Most of the precipitation influx stalled south of I-40, bringing scant relief for the dry second half of the monsoon we had in August.

September 18-25 Observed Precipitation resulting from Hurricane Odile.  Source.  
Based on a weak, but developing, El Nino this autumn is forecast to continue above-average precipitation.


Friday, September 05, 2014

Review of Soil Moisture Measurement Techniques


Advances in efficient, broad measurement of soil moisture are needed to understand plant stress response to drought.  Crop growth and phenology can be predicted (link) with accurate modeling of soil-plant-atmosphere interactions.  These dynamics are also crucial for advances in meteorology, since most rain that falls in the U.S. is recycled rain that has already fallen and evaporated at least once before, but often several times.  Accurate prediction of rainfall will continue to elude meteorologists until soil moisture can be measured and predicted.

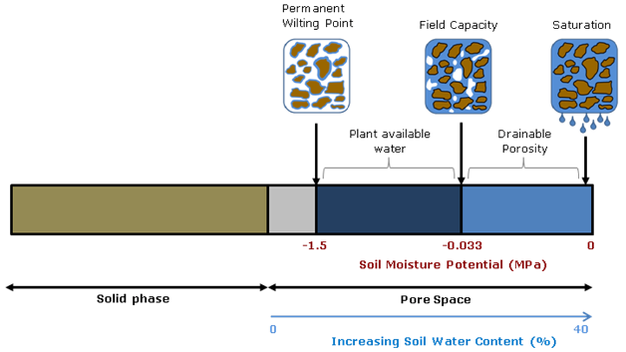
Soil moisture is critical for advancing plant and atmospheric sciences,  but the fact that different measurement techniques yield different values points to the fact that soil moisture is essentially an abstract idea.  While the water content of soil would seem to be straightforward, whether you calculate volumetric or gravimetric water content, and whether you consider chemically- and physically-immobilized water or only plant-available water (field capacity minus permanent wilting point) matters a great deal.


Diagram source.

Spatial and temporal scale also matters.  Do you want an instantaneous point measurement, or a daily weekly average for an entire county’s drought status?  Picking the right tool for the job means understanding the streghths and weaknesses of the entire gamut of technologies capable of reporting soil moisture.  This article will start with traditional in situ point measurement techniques and continue to review broad-scale soil moisture modeling and remote-sensing efforts.


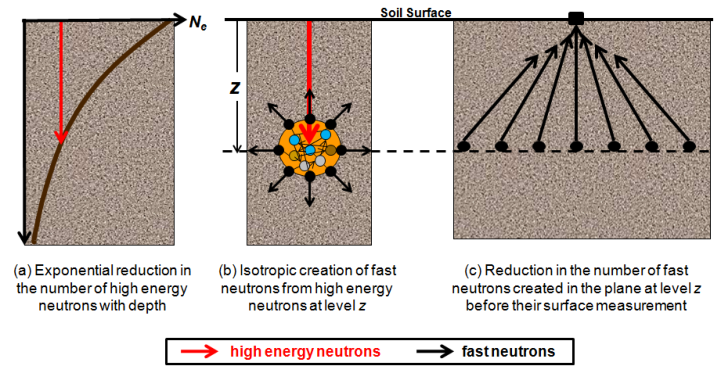
from Shuttleworth 2013

Small-scale measurement can be accomplished using point-sampling with portable soil moisture probes, such as TDR and traditional (active) neutron probes.  Of course, any discussion of soil moisture measurement techniques would be incomplete without mentioning the gravimetric method, or simply weighing a soil sample wet and then dry.  But as with the other point techniques, this method can only measure hyperlocal conditions and must be replicated and averaged to inform landscape-scale management.

TDR, or time-domain reflectometry, uses the electrical properties of soil and water to calculate volumetric percent soil moisture.  For most soils, excluding those with very high organic matter (OM>10%), the TDR method without calibration provides water content in the range from zero to 50% with accuracy better than 1-2%.  While calibration and new TDR such as TRIME-TDR can improve accuracy by a factor of 10-100, the amount of microscale variability in soil means that these point measurements must be replicated dozens to hundreds of times to build up a picture of average site moisture. Microvariability can be important when precipitation preferentially flow along soil heterogeneities such as roots, textural changes, and bioturbation pathways.    Buried probes that use the TDR techniques, such as the Stevens Hydroprobes I used in my graduate research, are fixed in place and are therefore severely limited by their inability to average site variability.
  
Traditional neutron probes work by bombarding the soil with high-energy neutrons and recording the number of neutrons emitted by the soil.  Hydrogen absorbs neutrons so the amount of H2O can be calculated.  This technique solves many of the problems of TDR, but the sensors are expensive and the measurement still must be repeated several times to measure field soil moisture.  

-

Meso-scale measurement can now be accomplished using the new COSMOS (Cosmic-ray Surface MOisture Sensor) program to measure whole ecosystem moisture.  Neutron moisture probes have been around for decades but COSMOS uses advances in particle-physics technology to increase sensitivity enough to rely solely on the background cosmic radiation as a uniform source of neutrons.  This advance makes possible, for the first time, instantaneous field-scale measurement of soil moisture.


These new sensors were originally deployed in 2010. They have the potential to revolutionize studies of soil moisture because they are the only technique to measure soil moisture at scales between the hyper-local point measurements and the kilometer-swaths of satellites.  They also are the only soil moisture probe that can account for water stores in living tissue.  According to Hydroinnova, one company that makes these $10,000 units, the measured soil footprint is 86% within 350 meters and the effective measuring depth changes with soil moisture, from a maximum of 70 cm in completely dry soil, to a minimum of 12 cm in saturated soil. 


Source.
While these sensors are few in number and relatively widely dispersed, they offer a whole new picture of soil moisture at the landscape level.  They are the only truly effective direct measure of soil moisture at the hectare level, and can be used to better calibrate the informational products discussed below.  However, as with all techniques, COSMOS must also be calibrated to take account of different soil types and changes in vegetation.

-

Large-scale measurement of soil moisture can be accomplished using proxies, satellites, models, or some combination of techniques.

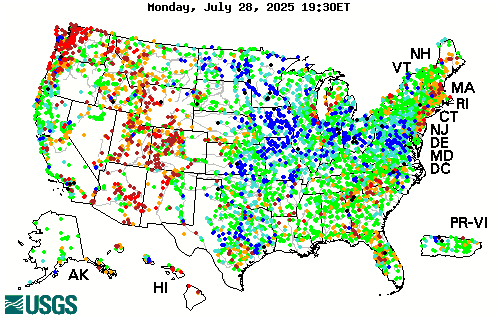
River flow data can reveal how much water is running off or through the soil from watersheds, so using a site like the USGSstreamflow network is a good proxy for large-scale short-term drought and deluge.


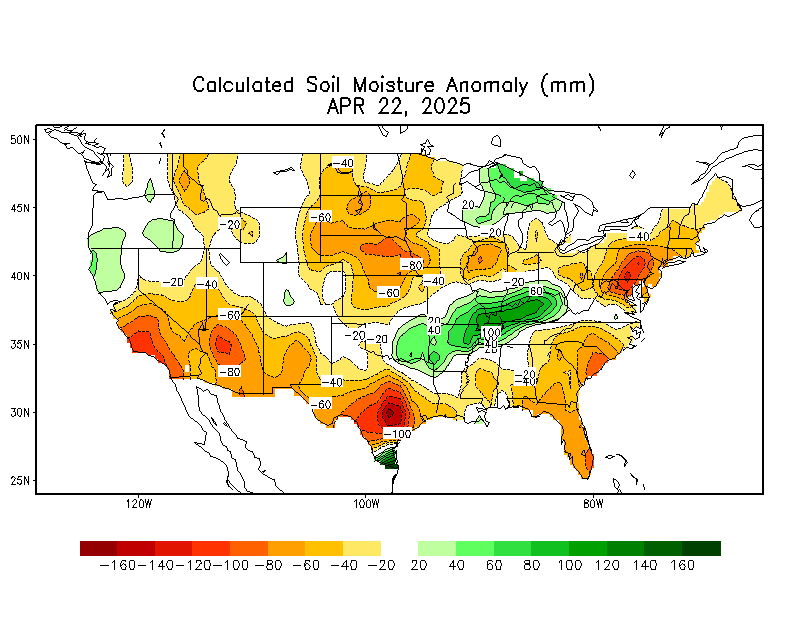
The current best methods for estimating large-scale soil moisture are the Drought.gov model products, which include the Palmer Drought Severity Index, soil moisture index, etc.  The Calculated Soil Moisture Anomaly is calculated based on observed precipitation and temperature.  Soil moisture, evaporation, and runoff for the entire US and globe are then modeled based on observations from a small area of eastern Oklahoma.  While this method is clearly biased, it is the best available.

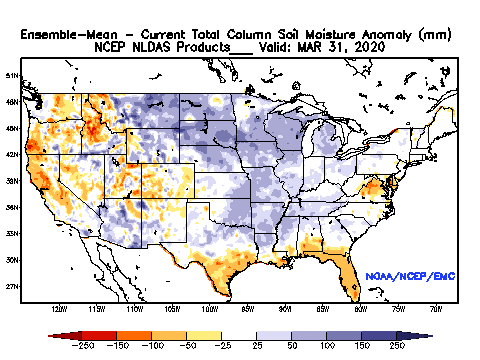
The National Land Data Acquisition System is developing a more accurate model of soil moisture that incorporates soil textural properties and average percent vegetation (which impacts evapotranspiration).  The precipitation data used in the model is at approximately 25km resolution, interpolated to 13km grid cells:


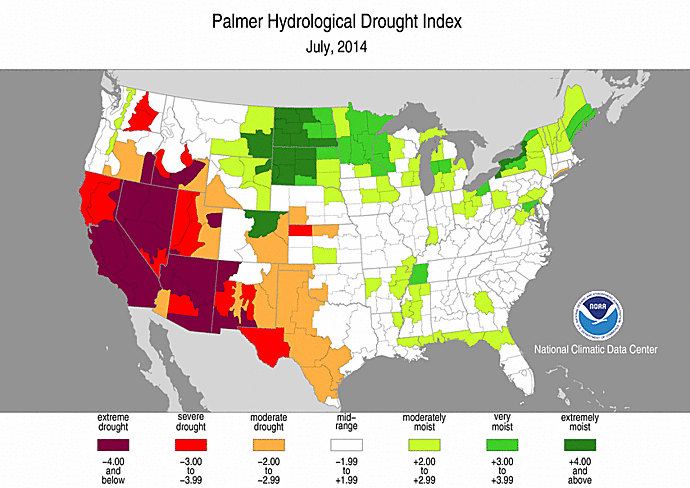
Palmer Drought Indices are similar to soil moisture models in that precipitation, evapotranspiration, and runoff are used to calculate remaining water balance.  There are long-term (Palmer Drought Index (PDI) and Palmer Hydrological Drought Index (PHDI) indices that measure changes in groundwater and reservoir levels, and short-term indices (Palmer Z Index and Crop Moisture Index (CMI)) that affect agriculture during the growing season.


 Interestingly, the US Drought Monitor, which looks essentially like one of the Palmer indices, is subjectively drawn using “a blend of science and subjectivity”.


Wednesday, September 03, 2014

Smoke from Jemez Mountains Controlled Burn Impacts Albuquerque

The fire was caused by lightening in the foothills of the Jemez Mountains more than two weeks ago. Instead of suppressing the fire, managers have used the smoldering blaze to burn out undergrowth and unhealthy Ponderosa thickets. While the forest is moist enough to preclude any danger of catastrophic fire, that moisture may also increase the amount of smoke.


Last night smoke from the fire drained down the Jemez River valley and into the Albuquerque metro area. By this morning the smog was visible as a distinct haze in the valley. Clear skies and dry air probably helped establish an inversion that contained the smoke within the valley. The smoke quickly dissipated once daytime convection began.

ABQ Journal Photo
The Albuquerque branch of the National Weather Service noted that the "smoke event" this morning was "dense" and "impactful".  Some politicians have used the smoke to argue against this type of forest restoration.

 The NWS does not expect smoke to be as bad today as it was yesterday. But on a recent update to Inciweb, fire managers note that "hand and aerial ignitions will be used again today to direct the wildfire over an area similar in size to yesterday’s activity. Large columns of smoke from this ignition will be visible..."

Current air quality information can be found at http://www.nmenv.state.nm.us/aqb/PinoFireInformation.htm.


Monday, August 25, 2014

Good Monsoons so far in New Mexico!

Almost the end of August and the climatological "monsoon" in the Southwest should be wrapping up around the first or second week of September. The last two months of rains have been sporadic, but significantly above average in the Land of Enchantment. Most areas in central NM are above 150% of normal for the season, and there are many areas that have tripled their average summer rainfall!

Tuesday, November 19, 2013

Best Public Lands GIS

There are no perfect web viewers for ecological and public land GIS.

ProtectedPlanet is an open-source platform that has the most comprehensive map of special protected areas for the whole world.  In the US, highlights include BLM Areas of Critical Environmental Concern (ACEC), USFS Research Natural Areas, Special Botanical Areas, etc.

Peakbagger.com has the best index of free online topo maps, and their database is searchable for mountain ranges and peaks (Google often can't find geographic features).

SEINet is fast becoming the most comprehensive botanical specimen map database in the world, with new collections constantly expanding their coverage.

Wundermap has many useful features, including a better display of, for example, USGS's Stream Gauge Network, as well as weather and sea surface temperature.

I'm still trying to decide if the Forest Service's ForWarn system, or their Disturbance Mapper, is a better way to view forest fire, insect infestation, and phenology data.  Both are slow and clunky as of this writing.

Monday, November 11, 2013

New Yorker article fails to fact-check

A recent article in the New Yorker magazine features a profile of a the Climate Company, which offers individualized weather prediction services to farmers.  Unfortunately, the article makes a number of unfounded or vague assertions, and in some places is so boosterish of the new company that it veers into puff piece journalism.

A balanced review of the company's claims would better serve readers, and a more in-depth review of the science might help explain why.

For example, the article by Michael Specter, claims that

"If you are trying to decide whether to take an umbrella to work, the National Weather Service provides the kind of information you need. But the data, often taken from readings at local airports, are nearly useless for anyone who needs to gauge constantly changing conditions in the soil and the atmosphere."

But the NWS does offer zip-code specific weather readings and predictions.   While it would be great to have even better location-specific data, such a monitoring system is yet to be implemented.

"One of the company’s principal sources is Nexrad, or Next Generation Radar, a network of a hundred and fifty-nine Doppler radar stations operated by the National Weather Service. Using data from the system, the Climate Corporation creates moisture and precipitation maps so precise that in some cases a farmer can determine whether the field on one side of a road is wetter than the field on the other side. "

All private companies use NWS radar and satellite information, and are limited by the resolution of this data.  The highest resolution data available is 4 km grid boxes.  

According to local meteorologists, it is not possible to distinguish accumulating precipitation at smaller scales without installing individual weather stations on either side of the road.

"Soil type and quality can vary widely within a county, and even within a single farm field."

This quote is used to imply that the Climate Company has such intra-field soil data, but Climate.com cannot account for every possible difference in soil texture.  It uses NRCS soil survey data compiled in the 1960's and 1970's for every county in the U.S.  

On their webpage, Climate.com requests farmers fill in their specific soil type.  There is no high-tech substitute for good old-fashioned soil testing.  

The article also features such gee-whiz promotional quotes as "the algorithm divides the country into nearly half a million plots, then generates ten thousand daily weather scenarios for each of them... It matched that information with reports from two million locations that the National Weather Service scans regularly with Doppler radar."

Again, I spoke to several practicing meteorologists who were not sure how these absurdly large and contradictory numbers were computed.  Their best guess was that Climate.com is counting the same location more than once, for each radar beam, or that they are counting different layers in the atmosphere as different "locations."  

Alternately, these discrepancies may be misquotes on the part of the author that were not picked up by New Yorker fact checkers.   

Friday, March 01, 2013

Water Year

Now that it is March and the winter rains are almost finished, let's look at who got what.  The West remains in a deep drought.

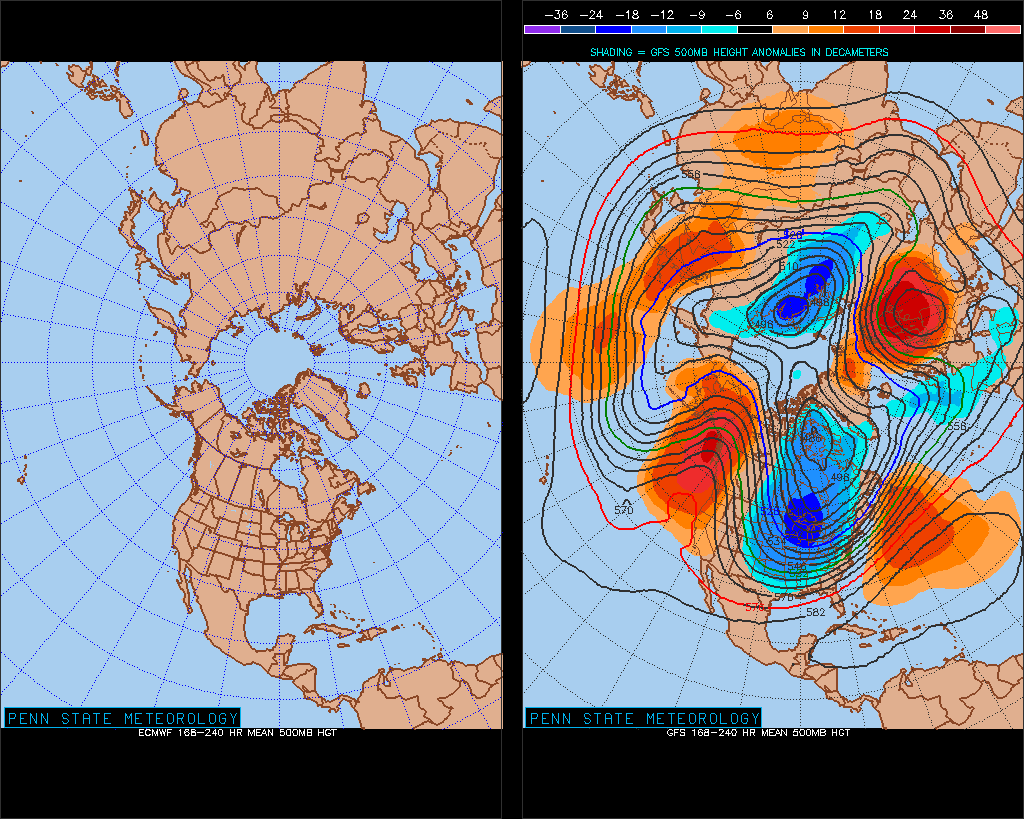
 Do Highs and Lows (e.g. 500mb height anomalies) force jet stream diversions or does jet stream bunching and coiling create ridge and troughs and hence Highs and Lows?


The Weather Channel notes that February upper-level (jet stream) synoptic pattern brought very cold air to the Eastern U.S.

Looking ahead to May, they predict that the continuing drought in the Western Plains will continue and set up a feedback loop: drier surface conditions will create a bubble of high pressure air that will in turn influence the average track of the jet stream, pushing storms north of the rain-starved regions.  This is just one possibility, however, and even then only reflects average conditions.

Sunday, February 03, 2013

February Blocking Pattern

This computer model (GFS) of near-surface temperature (actually, just above the boundary layer) and atmospheric pressure shows an interesting pattern of high and low pressure areas.  A high pressure region over the Azores is predicted to hold steady for the next several weeks, in effect blocking the normal flow of the jet stream and Eastward-migrating low pressure regions.  These lows are forced to travel (clockwise) all the way around the high pressure region.  The consequence appears to be a trough in the jet stream over Eastern  North America, leading to large incursions of Arctic air, and very, very cold temperatures (see graph).

Saturday, March 24, 2012

Summer in Spring 2012

"This March, we started with twelve days of April weather, followed by ten days of June and July weather, with nine days of May weather predicted to round out the month"
image from Dr. Jeff Masters