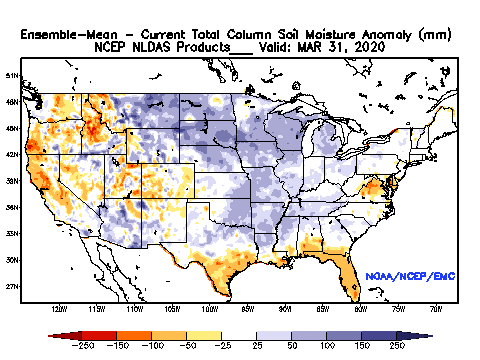
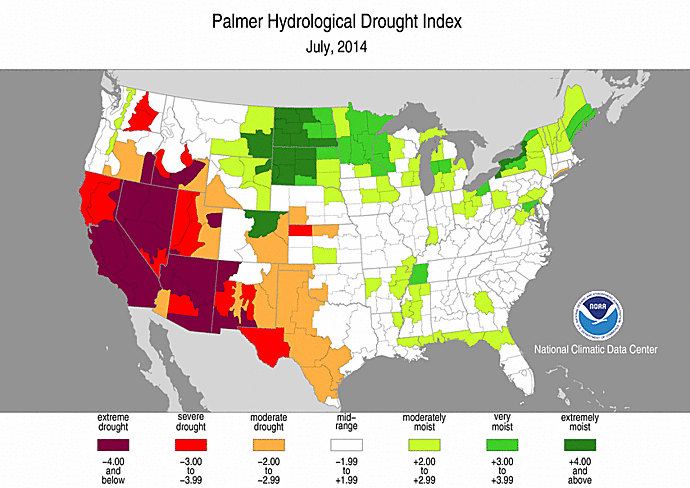
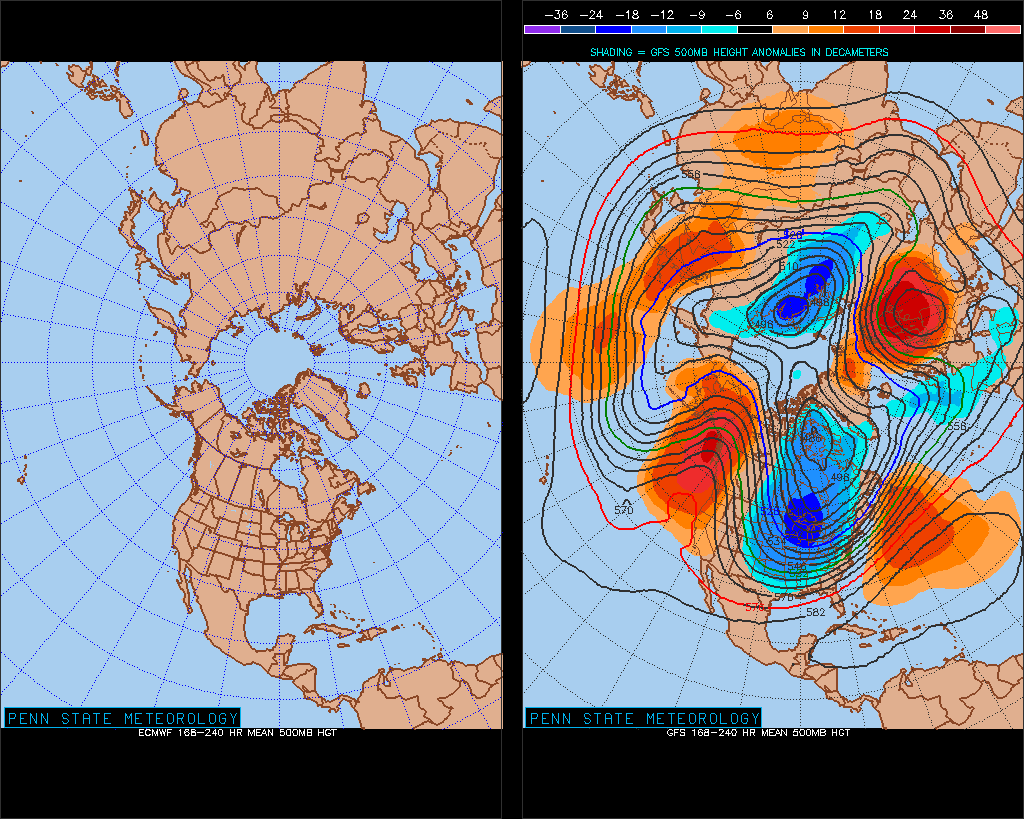
How to find green growing plants in Arizona, a state famous for its long droughts and intermittent, but torrential, rains? Previously I reviewed the available public models for drought, NDVI, and rainfall, and concluded that rainfall was most useful. However, the most important factor for plant growth is regular consistent rain. Not drought, but also not deluge. I hypothesized that a consistent "drip" of at least 1/4 inch of rain each week would yield the best plant growth, and I created a GIS model to map this.
Thursday, March 06, 2025
The DRIP Model: Not Drought nor Deluge
Wednesday, July 24, 2024
Rain Walks
This is a story from Paul Krafel that I think should be more widely known and celebrated. Thank you, Paul.
Rain Walks
A simple play I’ve made hundreds of times exemplifies “every play is two plays.” High in the drainage, as runoff increases, the rising runoff begins overflowing its shallow channels, spreading out into easily overlooked overflow routes. Sometimes a rock lies in the overflow channel, obstructing how much of the runoff can flow that way. I lift the rock out of the channel so that more of the runoff can flow in this new direction (Play One). I then place that rock in the main channel so that it shunts more of the runoff towards the overflow channel (Play Two).
This simple moving of the rock is two plays. The broader, slower overflow route receives more runoff because of the removal of the rock, and the deeper main channel receives less because of the new placement of that rock. Though much of the water still flows down the main channel, more is now flowing along the broader, slower overflow route.
Rising water has a distinctive appearance. Surface tension holds the water’s surface against plant stems and rock edges so that this ring of contact lags behind the rising level of the surrounding water. This creates a dimpled surface around each stem and rock sticking up out of the water. These dimpled surfaces sparkle with focused light. I can watch this dance of light advance with the increased flow down the overflow route.
Read more here...
Another interesting article by Paul here.
Tuesday, September 28, 2021
2021 Arizona Monsoons
It was a good monsoon in AZ this year, with some locations up 8 to 12 inches above normal (June-September 8). But due to the uneven distribution of thunderstorms, even in this good year some areas barely received normal!
Wednesday, September 28, 2016
Albuquerque 2016 Monsoon Season
| From the ABQ NWS Homepage. |
Tuesday, December 22, 2015
A New Precipitation-Evapotranspiration Index to Map Global Drought
| Long-term drought graph for NM. |
Friday, December 18, 2015
2015 New Mexico Weather Recap
| The 2015 monsoon season got off to a quick start with heavy rainfall, floods, flash floods and severe weather in mid and late June, as well as the first two weeks of July. A relatively quiet period ensued for most of the remainder of July. A resurgence of heavy rain returned from very late July through early August. An outbreak of severe weather was the dominate weather story in mid August, and to a lesser extent on September 9th and 23rd. | ||||||
![]()
By the numbers: The Albuquerque NWS office issued 53 flash flood warnings between June 15 and September 30.
|
The biggest news of the year was probably the good precipitation that finally ended the drought that began in early 2011:
Drought conditions developed across New Mexico in early 2011, with few breaks in the drought through 2012, such that much of the state was gripped in the worst drought episode since the 1950s. Near normal statewide precipitation in 2013 and 2014 did little to improve the drought. Much of the precipitation in 2013 and 2014 fell during the monsoon season, rather than the much more needed winter mountain snowpack.
Finally, New Mexico precipitation in 2015 was above normal for much of the year, and the period January through November was the fifth wettest on record since 1895. As shown in the graph to the right, precipitation in New Mexico was well above average in January, May, July and October, with only two months below average - August and September. These wetter than normal conditions supported a steady reduction in the intensity and coverage of the short term drought. Finally, in early December 2015 New Mexico was drought free! The last time the state was without any drought status was the week of November 23, 2010!
By the numbers: New Mexico went 263 weeks with a portion of the state in moderate or worse drought!
| ![]() | |||||
![]() | ||||||
| Source: U.S. Drought Monitor | ||||||
Friday, October 02, 2015
2015 Summer Monsoon Totals
The NWS maintains a report of monsoon totals for the ABQ metro area.
![]() |
| Percent of normal monsoon moisture received in July, August, and September 2015. |
![]() |
| Moisture during the summer was spotty, but usually above average. |
Thursday, September 25, 2014
Hurricane Odile Rain in New Mexico
The area around Carlsbad Caverns in particular has had more than 20 inches in the last week, more than any other location in the U.S. Most of the precipitation influx stalled south of I-40, bringing scant relief for the dry second half of the monsoon we had in August.
![]() |
| September 18-25 Observed Precipitation resulting from Hurricane Odile. Source. |
Friday, September 05, 2014
Review of Soil Moisture Measurement Techniques
Advances in efficient, broad measurement of soil moisture are needed to understand plant stress response to drought. Crop growth and phenology can be predicted (link) with accurate modeling of soil-plant-atmosphere interactions. These dynamics are also crucial for advances in meteorology, since most rain that falls in the U.S. is recycled rain that has already fallen and evaporated at least once before, but often several times. Accurate prediction of rainfall will continue to elude meteorologists until soil moisture can be measured and predicted.
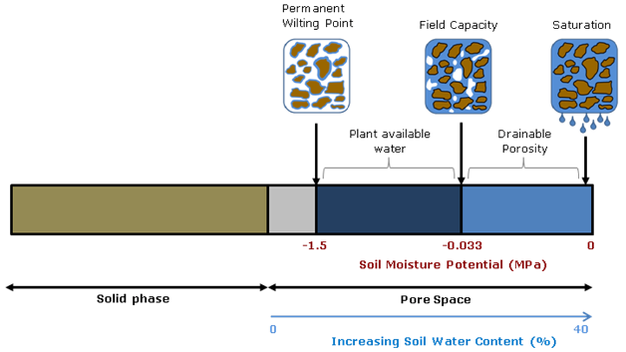
Soil moisture is critical for advancing plant and atmospheric sciences, but the fact that different measurement techniques yield different values points to the fact that soil moisture is essentially an abstract idea. While the water content of soil would seem to be straightforward, whether you calculate volumetric or gravimetric water content, and whether you consider chemically- and physically-immobilized water or only plant-available water (field capacity minus permanent wilting point) matters a great deal.
Diagram source.
Spatial and temporal scale also matters. Do you want an instantaneous point measurement, or a daily weekly average for an entire county’s drought status? Picking the right tool for the job means understanding the streghths and weaknesses of the entire gamut of technologies capable of reporting soil moisture. This article will start with traditional in situ point measurement techniques and continue to review broad-scale soil moisture modeling and remote-sensing efforts.
![]() |
| from Shuttleworth 2013 |
-
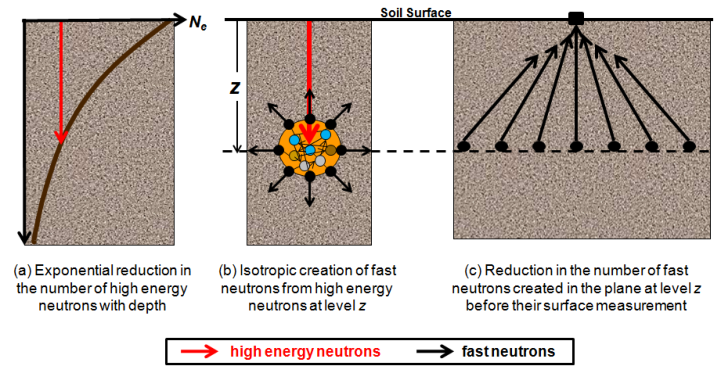
Meso-scale measurement can now be accomplished using the new COSMOS (Cosmic-ray Surface MOisture Sensor) program to measure whole ecosystem moisture. Neutron moisture probes have been around for decades but COSMOS uses advances in particle-physics technology to increase sensitivity enough to rely solely on the background cosmic radiation as a uniform source of neutrons. This advance makes possible, for the first time, instantaneous field-scale measurement of soil moisture.
![]() |
| Source. |
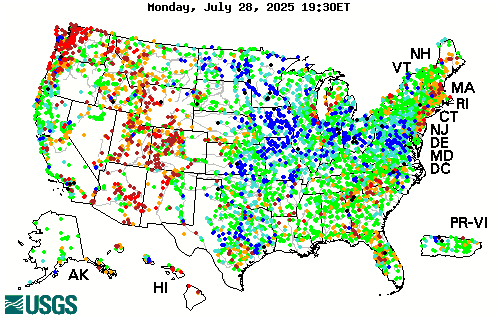
River flow data can reveal how much water is running off or through the soil from watersheds, so using a site like the USGSstreamflow network is a good proxy for large-scale short-term drought and deluge.
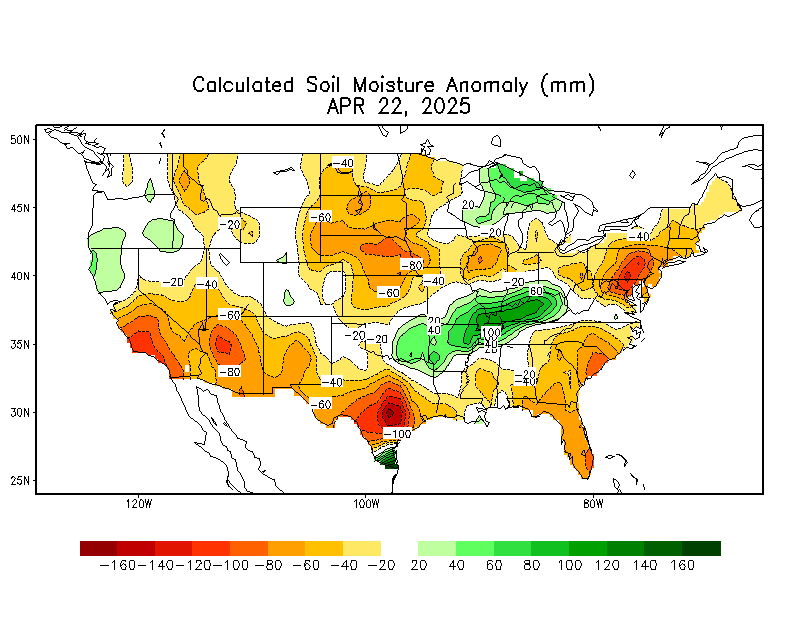
The National Land Data Acquisition System is developing a more accurate model of soil moisture that incorporates soil textural properties and average percent vegetation (which impacts evapotranspiration). The precipitation data used in the model is at approximately 25km resolution, interpolated to 13km grid cells:
Thursday, September 04, 2014
Problems Modeling Soil Moisture: Calculating Rainfall
East of the Continental Divide, radar imagery is compared to ground rain gauges and a correction factor is calculated. In mountainous areas West of the Continental Divide, a different method is used to derive the "observed precipitation". Ground rain gauge data is compared to average precipitation data (PRISM) and departures from that average are interpolated between gauge locations. The end result is 4km resolution rainfall totals.
Once observed precipitation is calculated, accumulated precipitation can be viewed for any time period using NOAA's website.
Clearly, 4km by 4km grid cells hide a great deal of local variability. For example, the Rainlog network of rain gauges in Tucson records highly variable rainfall at locations less than a kilometer apart during the monsoons (W Miracle Mile is about 2 km):
Methodological problems in the way PRISM fills gaps using modeled historical data may bias against extreme or unusual rainfall patterns. Also, numerous sources of bias in both the radar and the rain gauges have to be accounted for manually. For example, radar can be biased by hail, angle, and artifacts created by birds and insects. Rain gauges can also malfunction in an endless variety of ways, including sensor error, human error, and when ice and snow block the gauge. These uncertainties in observed precipitation can jeopardize efforts to model soil moisture such as the PDI. Also, they call into question research that has revealed an increase in extreme precipitation events.
Existing large-scale methods of modelling soil moisture are unconstrained by field measurements, so the advent of satellites offering weekly global measurements of soil moisture are an important step forward. These satellites (such as SMOS) can image vast swaths of the Earth’s surface to infer average soil moisture at the surface, but this imagery has an accuracy of +/- 4% soil moisture over pixels that are 35-50 km on a side. A new satellite launched this year (SMAP) has better resolution, approximately 9 km, but still nowhere near field-scale resolution. Local hill slope, vegetation land cover, and soil texture differences mean that county-level averages aren't accurate enough to apply on individual acres.
There are some companies that claim to be able to remotely monitor acre-by-acre soil moisture for farmers, but that is not possible without field measurements.
Sunday, November 24, 2013
An Important Point about Grazing-based Land Restoration
--Jeff Burgess, reader response in the November/December 2013 Nature Conservancy magazine
Addendum: read this comprehensive response to Allan Savory's claims, or this recent direct rebuttal:
The Savory Method can not green deserts or reverse climate change, Briske, David D., Bestelmeyer Brandon T., Brown Joel R.,Fuhlendorf Samuel D., and H. Polley Wayne , Rangelands, Volume 35, Issue 5, p.72-74, (2013)
and this follow-up:
Friday, March 01, 2013
Water Year

The Weather Channel notes that February upper-level (jet stream) synoptic pattern brought very cold air to the Eastern U.S.

Looking ahead to May, they predict that the continuing drought in the Western Plains will continue and set up a feedback loop: drier surface conditions will create a bubble of high pressure air that will in turn influence the average track of the jet stream, pushing storms north of the rain-starved regions. This is just one possibility, however, and even then only reflects average conditions.
Wednesday, February 06, 2013
Bankfull Flood on the Haw River, North Carolina
Let's see what the USGS Gauge at Bynum says.
A gauge height over 11 feet counts as a flood...and it is more than 7 feet above current flow. Note that this is a very wide river, so the actual volume was much more than 7 times...according to the USGS calculation, the flow was near 20,000 CFS, over 30 times the current flow of 600 CFS.
How does the compare to previous floods?
This January flood appears to be a bankfull event that was surpassed in 2008 (the first year of record for Bynum), 2009, and 2010, (but not in 2011 or 2012). Many of these large floods happen in the early spring, perhaps when the heavy rains fall on an already-saturated watershed.
This is what happened the week of January 13th. On top of the previous week's rain, there was significant rain on Monday the 14th and Wednesday the 16th. The storm continued into Thursday, bringing more than an inch of thunderstorm rain (and snow) on top of the saturated landscape. The Haw river flow peaked soon thereafter, in the early morning hours of January 18th.
Tuesday, July 24, 2012
Monday, April 20, 2009
Climate Change, by U.S. State

You can also see how the seasons are changing.